
As of March 18, 2025, NVIDIA Triton Inference Server is now part of the NVIDIA Dynamo Platform and has been renamed to NVIDIA Dynamo Triton, accordingly.
Large language models (LLMs) have been widely used for chatbots, content generation, summarization, classification, translation, and more. State-of-the-art LLMs and foundation models, such as Llama, Gemma, GPT, and Nemotron, have demonstrated human-like understanding and generative abilities. Thanks to these models, AI developers do not need to go through the expensive and time consuming training process from scratch.
Techniques such as retrieval-augmented generation (RAG), prompt engineering, and fine-tuning can be applied to customize foundation models and achieve higher accuracy for specific tasks in much shorter time. The customized models can be deployed in production quickly and serve inference requests for a wide range of use cases.
This post provides step-by-step instructions on how to optimize LLMs using NVIDIA TensorRT-LLM, deploy the optimized models with NVIDIA Triton Inference Server, and autoscale LLM deployment in a Kubernetes environment.
NVIDIA TensorRT-LLM is an easy-to-use Python API that defines and optimizes LLMs. NVIDIA Triton Inference Server is an open-source inference serving software that supports multiple frameworks and hardware platforms. TensorRT-LLM provides multiple optimizations such as kernel fusion, quantization, in-flight batch, and paged attention, so that inference using the optimized models can be performed efficiently on NVIDIA GPUs.
Triton Inference Server supports multiple deep learning and machine learning frameworks, including NVIDIA TensorRT, TensorFlow, PyTorch, and ONNX. It supports multiple query types, including real time, batched, ensembles, or streaming. It can run across cloud, data center, edge and embedded devices on NVIDIA GPUs, x86 and ARM CPUs. As a developer, you can first build TensorRT engines that contain the model optimizations, then deploy the optimized models with Triton in production.
You can scale up the deployment of the optimized LLMs from a single GPU to multiple GPUs with Kubernetes, to handle thousands of real-time inference requests with low latency and high accuracy, and scale down the number of GPUs when the volume of inference requests decreases. This is especially useful for enterprises, such as online shopping and call centers, when handling different volumes of inference requests during both peak and non-peak hours with flexibility, while benefiting from the reduced total cost compared to purchasing the maximum number of hardware resources to handle the peak workloads.
Triton metrics are scraped by Prometheus and sent to Horizontal Pod Autoscaler (HPA) to make decisions on scaling up or down the number of deployment and GPUs based on the amount of the inference requests. To see the code and steps for this optimization and deployment, visit triton-inference-server / tutorials on GitHub.
Hardware and software requirements
For optimizing and deploying your models, you need to have NVIDIA GPUs that support TensorRT-LLM and Triton Inference Server. It is recommended to use the new generations of NVIDIA GPUs. You can find the list of supported GPUs in the hardware section of the support matrix for TensorRT-LLM. You can also deploy your models on public cloud compute instances with the appropriate GPU resources such as AWS EKS, Azure AKS, GCP GKE, or OCI OKE.
Kubernetes can be used to scale your deployment automatically to handle large-scale real-time inference requests with low latency. To enable Kubernetes to discover which nodes have GPUs and make them available to containers running on those nodes, install the Kubernetes node feature discovery service, NVIDIA device plugin for Kubernetes, GPU Feature Discovery service, and NVIDIA DCGM Exporter. You also need to install Prometheus to collect metrics for autoscaling. See detailed installation steps.
Optimize LLMs with TensorRT-LLM
TensorRT-LLM supports a variety of state-of-the-art models. You can download the model checkpoints from Hugging Face, then use TensorRT-LLM to build engines that contain the model optimizations. To download the LLMs, you will need an access token. You can then create a Kubenetes secret with the access token, which will be used in a later step of Kubernetes Deployment to download the models.
$ kubectl create secret generic hf-model-pull '--from-literal=password=<HF_access_token>'
To understand more about how TensorRT-LLM works, explore examples of how to build the engines of the popular models with optimizations to get better performance, for example, adding gpt_attention_plugin, paged_kv_cache, gemm_plugin, quantization.
To generate TensorRT engine files, you can use the Docker container image of Triton Inference Server with TensorRT-LLM provided on NVIDIA GPU Cloud (NGC). To pull the container image from NGC, you need to generate an API key on NGC that enables you access to the NGC containers. Next, log in to NGC using the API key to pull the container image.
After pulling the NGC image of Triton with TensorRT-LLM—for example, the base image nvcr.io/nvidia/tritonserver:24.08-trtllm-python-py3—generate TensorRT-LLM engine files referencing the Model Preparation Steps. Based on the model size and GPU memory size, you can configure TP tensor parallelism (TP) and pipeline parallelism (PP). Note that you need a minimum number of GPUs, TP*PP, for generating the engine files.
Create a custom Triton-TensorRT-LLM image following the Custom Container Image steps and scripts. After building the custom image, you can push it to a repository that your cluster can access. To pull this customized image from a private registry during deployment, you need to create a Kubernetes docker-registry secret with the API key and let Kubernetes use the secret to pull the image from the private registry.
During deployment, the generated TensorRT engine and plan files are stored in the host node and remapped to all the Kubernetes Pods on the same node. This eliminates the need to generate the same files if more Pods are scaled up later.
Autoscale deployment of LLMs with Kubernetes
After optimizing your LLMs with TensorRT-LLM, you can deploy the models using Triton and autoscale the deployment with Kubernetes. Three main steps are required to deploy LLMs for AI inference:
- Create a Kubernetes Deployment for Triton servers
- Create a Kubernetes Service to expose the Triton servers as a network service
- Autoscale the Deployment using Horizontal Pod Autoscaler (HPA) based on Triton metrics scraped by Prometheus
Helm chart for LLM deployment
You can use a Helm chart for deployment, as it is easy to modify and deploy across different environments. To find the Helm chart, see Autoscaling and Load Balancing Generative AI with Triton Server and TensorRT-LLM. Inside the chart directory, Helm expects the files as below:
chart.yaml holds all the information about the chart you are packaging; for example, version number and name.
values.yaml defines all the values you want to inject into your templates directory, including the supported GPUs, LLMs, the container image of Triton, image pull secrets, and so on. You can create a custom values file that is specific to your model, custom image, and GPU type to overwrite values.yaml. The following example is a gpt2_values.yaml for deploying a GPT-2 model on an NVIDIA A10G GPU.
gpu:
- NVIDIA-A10G

model:
  name: gpt2
  tensorrtLlm:
    parallelism:
      tensor: 1

triton:
  image:
    pullSecrets:
    -name: ngc-container-pull
    name: <your custom image>
If you have a larger model that does not fit on a single GPU, you can configure TP based on the model and GPU size. For example, you can set model.tensorrtLlm.parallelism.tensor to 2 for a model that needs two GPUs, and each Kubernetes Pod has two GPUs in Deployment.
Create a Kubernetes Deployment
A Kubernetes Deployment provides declarative updates for Kubernetes Pods and ReplicaSets. The deployment.yaml creates a set of replicated Pods for Triton servers. You can specify how many Pods to start your deployment with, indicated by the .spec.replicas field.
The .spec.containers field tells each Kubernetes Pod to have a Triton server container running on a GPU. Port numbers 8000 and 8001 are specified for Triton servers to receive inference requests from clients by HPPP and GRPC, respectively. Port 8002 is for collecting Triton metrics. You may change the .resources.ephemeral-storage field to adapt to the size of your model; for example, a GPT-2 model can fit in 24 GB memory of NVIDIA A10G GPU.
apiVersion: apps/v1
kind: Deployment
metadata:
  […]
spec:
  selector:
  […]
  replicas: 1
  template:
    metadata:
      labels:
        app: {{ $.Release.Name }}
        app.kubernetes.io/component: server
……
spec:
      […]
      containers:
        - name: triton
          [...]
          image: {{ $image_name }}
          imagePullPolicy: IfNotPresent
          [...]
          ports:
          - containerPort: 8000
            name: http
          - containerPort: 8001
            name: grpc
          - containerPort: 8002
            name: metrics
Create a Kubernetes Service
A Kubernetes Service is an abstract way to expose an application running on a set of Pods as a network service. The service.yaml exposes Triton servers as a network service, so the servers are ready to receive inference requests from the clients.
apiVersion: v1
kind: Service
metadata:
  name: {{ $.Release.Name }}
  labels:
    app: {{ $.Release.Name }}
    app.kubernetes.io/component: service
……
spec:
  ports:
  - name: http
    port: 8000
    targetPort: http
  - name: grpc
    port: 8001
    targetPort: grpc
  - name: metrics
    port: 8002
    targetPort: metrics
  selector:
    app: {{ $.Release.Name }}
  type: ClusterIP
Autoscale LLM deployment
To autoscale the application, you need to monitor the application’s performance by examining the containers, Pods, Services. You can use either a PodMonitor or a ServiceMonitor to monitor Kubernetes Pods or Service for target discovery by Prometheus. Kube-Prometheus can help deploy Prometheus and link Prometheus to metric endpoints. You can expose NVIDIA Triton metrics to Prometheus using PodMonitor and Kube-Prometheus.
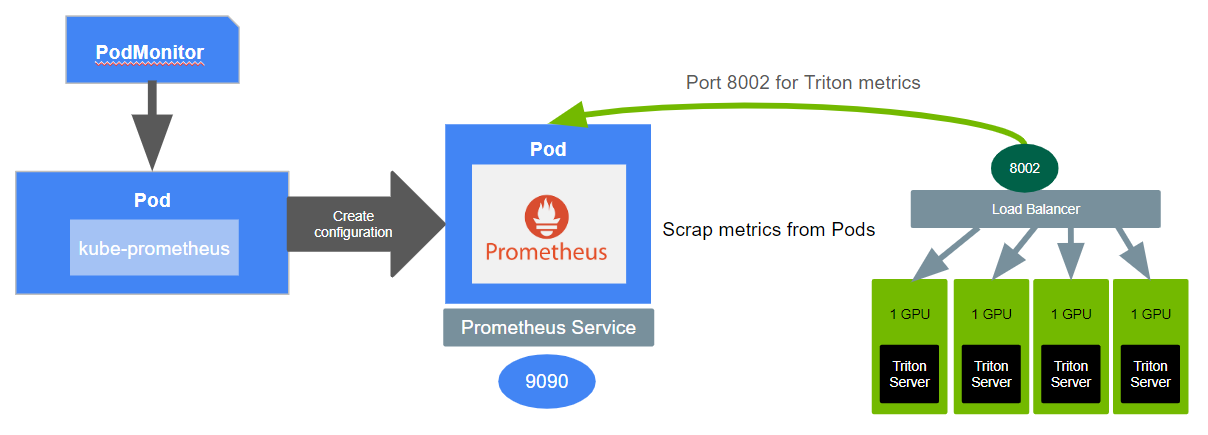
The pod-monitor.yaml file below uses PodMonitor to monitor Pods, each having a Triton server:
apiVersion: monitoring.coreos.com/v1
kind: PodMonitor
metadata:
  name: {{ $.Release.Name }}
  labels:
    app: {{ $.Release.Name }}
    app.kubernetes.io/component: autoscaler
    release: prometheus
……
spec:
  selector:
    matchLabels:
      app: {{ $.Release.Name }}
      app.kubernetes.io/component: server
  podMetricsEndpoints:
  - port: metrics
    path: /metrics
Prometheus can scrape Triton metrics from all the Kubernetes Pods at Port number 8002. You can choose a Triton for HPA, or define a new custom metric using the collected metrics based on your requirement. Prometheus adapter communicates with both Kubernetes and Prometheus, acting as a translator between the two. With the help from the Prometheus adapter, HPA can use the selected metric to autoscale the replica number of Kubernetes Pods based on the volume of the inference requests.
In this application, a custom metric, called queue-to-compute ratio, is used as the metric for HPA. The queue-to-compute ratio reflects the response time of inference requests. It’s defined as the queue time divided by the compute time for an inference request in the triton-metrics_prometheus-rule.yaml below.
apiVersion: monitoring.coreos.com/v1
kind: PrometheusRule
metadata:
  name: triton-metrics
  labels:
    app.kubernetes.io/component: autoscaler
    release: prometheus
spec:
  groups:
  - name: autoscaling
    interval: 6s
    rules:
    # Average percentage of time inference requests spend in queue (not including cache hits).
    - expr: rate(nv_inference_queue_duration_us[1m])/clamp_min(rate(nv_inference_compute_infer_duration_us[1m]),1)
      record: triton:queue_compute:ratio
Prometheus scrapes Triton metrics with an interval of 6 seconds, and calculates the value of custom metric using the Triton metrics. Then HPA scales up and down the number of replicas based on the value of the custom metric.
The hpa.yaml below specifies the maximum and minimum numbers of replicas for deployment; for example, up to 4 Pods and at least 1 Pod. Use Pods for metrics-type to take the average of the queue-to-compute ratio across all the Pods. An average queue-to-compute ratio that is higher than the desired value 1,000 (milliunit) means the queue time is longer than the compute time, or the number of replica(s) is not enough to respond quickly to the inference requests. In this case, HPA should increase the number of replicas to reduce the queue-to-compute ratio until the custom metric is lower than the desired value, and vice versa if the volume of inference requests is reduced. This target value can be set at any number based on your requirements.
{{- $metric_name := "triton:queue_compute:ratio" }}
{{- $metric_value := "1000m" }}
{{- $replicasMax := 4 }}
{{- $replicasMin := 1 }}
……
apiVersion: autoscaling/v2
kind: HorizontalPodAutoscaler
metadata:
  name: {{ $.Release.Name }}
  labels:
    app: {{ $.Release.Name }}
    app.kubernetes.io/component: autoscaler
    release: prometheus
……
spec:
  maxReplicas: {{ $replicasMax }}
  minReplicas: {{ $replicasMin }}
  metrics:
  - type: Pods
    pods:
      metric:
        name: {{ $metric_name }}
      target:
        type: AverageValue
        averageValue: {{ $metric_value }}
  scaleTargetRef:
    apiVersion: apps/v1
    kind: Deployment
    name: {{ $.Release.Name }}
After configuring your .yaml files for Kubernetes Deployment, Service, PodMonitor, and HPA, you can deploy your model with Triton server and Kubernetes using the following command:
$ helm install gpt2 --values ./chart/values.yaml    --values ./chart/gpt2_values.yaml   --set 'triton.image.name=<your custom image>' ./chart/.
NAME: gpt2
LAST DEPLOYED: Mon Aug 26 23:04:42 2024
NAMESPACE: default
STATUS: deployed
REVISION: 1
TEST SUITE: None
NOTES:
triton_trt-llm_aslb-example (0.1.0) installation complete.

Release Name: gpt2
Namespace: default
Deployment Name: gpt2
Service Name: gpt2
Verify that everything is working as expected. You should be able to see the output information, such as NAME, READY, and STATUS for Pod; NAME, TYPE, and PORTS for Service; and NAME, MINPODS, MAXPODS, and REPLICAS for HPA, and so on.
$ kubectl get deployments,pods,hpa,services,podmonitors --selector='app=gpt2'
NAME                   READY   UP-TO-DATE   AVAILABLE   AGE
deployment.apps/gpt2   1/1     1            1           11m

NAME                        READY   STATUS    RESTARTS   AGE
pod/gpt2-85cfd5b6d5-4v87s   1/1     Running   0          11m

NAME                                       REFERENCE         TARGETS   MINPODS   MAXPODS   REPLICAS   AGE
horizontalpodautoscaler.autoscaling/gpt2   Deployment/gpt2   0/1       1         4         1          11m

NAME           TYPE        CLUSTER-IP      EXTERNAL-IP   PORT(S)                      AGE
service/gpt2   ClusterIP   10.100.56.211   <none>        8000/TCP,8001/TCP,8002/TCP   11m

NAME                                    AGE
podmonitor.monitoring.coreos.com/gpt2   11m
If the status of Pod is not running successfully, for example (the status shows Init:CrashLoopBackOff or ImagePullBackOff), you can try the following commands to debug the issue. Potential reasons for failure could be the model or custom image was not downloaded successfully, Kubernetes secrets are not working properly, out of memory, and so on.
$ kubectl describe pod <pod name>
$ kubectl logs <pod name> -c init
$ kubectl logs <pod name> -c init --previous
Load balancer
You also need a load balancer to distribute the workload among all the running Pods. There are mainly two types of load balancers: Layer 4 and Layer 7. Layer 4 load balancing operates at the transport level and manages traffic based on network information, while Layer 7 load balancing operates at the application level and uses protocols to make decisions based on the content of each message.
You can use a third-party load balancer such as Traefik ingress controller and load balancer, or NGINX Plus, which are both Layer 7. See more information about how to deploy Traefik and NGINX Plus. You can also use a cloud load balancer if you’re using a cloud service. For example, the AWS load balancer controller can provision both application and network load balancers. After installing the controller, you can ask the cloud controller to provision a network load balancer if the Service has the loadBalancer type, or an application load balancer if you create a Kubernetes ingress.
Send test inference requests
Finally, you can test the Triton servers by sending inference requests from clients. A sample client folder is provided from which you can build a client container image:
$ docker build -f ./containers/client.containerfile -t <name> ./containers/.
Next, modify the <model>.yaml file in the client folder to the name of the client container image that you built. Use the following commands to create the Deployment of the client with one replica:
 $ kubectl apply -f ./clients/gpt2.yaml
 deployment.apps/client-gpt2 created
Let the client increase or decrease the volume of inference requests by changing the number of replicas of the client, and check the Pods:
$ kubectl scale deployment/client-gpt2   --replicas=10
deployment.apps/client-gpt2 scaled

$ kubectl get pods
NAME                                READY   STATUS    RESTARTS   AGE
client-gpt2-cb4bf7b74-6g82l   1/1     Running   0          16s
client-gpt2-cb4bf7b74-6lt8x   1/1     Running   0          16s
client-gpt2-cb4bf7b74-6nnvn   1/1     Running   0          16s
client-gpt2-cb4bf7b74-b7s88   1/1     Running   0          16s
client-gpt2-cb4bf7b74-fl5c6   1/1     Running   0          36s
client-gpt2-cb4bf7b74-j88ld   1/1     Running   0          16s
client-gpt2-cb4bf7b74-jdmkm   1/1     Running   0          16s
client-gpt2-cb4bf7b74-lqptv   1/1     Running   0          16s
client-gpt2-cb4bf7b74-m66cx   1/1     Running   0          16s
client-gpt2-cb4bf7b74-nt7b7   1/1     Running   0          16s
gpt2-85cfd5b6d5-65ftt         1/1     Running   0          7m57s
You can see 10 clients running, which increases the number of inference requests significantly. This will increase the value of the custom metric, therefore causing HPA to increase the number of replicas of the Triton servers with GPT-2 models:
$ kubectl get pods
NAME                             READY   STATUS    RESTARTS   AGE
client-gpt2-cb4bf7b74-6g82l   1/1     Running   0          56s
client-gpt2-cb4bf7b74-6lt8x   1/1     Running   0          56s
client-gpt2-cb4bf7b74-6nnvn   1/1     Running   0          56s
client-gpt2-cb4bf7b74-b7s88   1/1     Running   0          56s
client-gpt2-cb4bf7b74-fl5c6   1/1     Running   0          76s
client-gpt2-cb4bf7b74-j88ld   1/1     Running   0          56s
client-gpt2-cb4bf7b74-jdmkm   1/1     Running   0          56s
client-gpt2-cb4bf7b74-lqptv   1/1     Running   0          56s
client-gpt2-cb4bf7b74-m66cx   1/1     Running   0          56s
client-gpt2-cb4bf7b74-nt7b7   1/1     Running   0          56s
gpt2-85cfd5b6d5-65ftt         1/1     Running   0          8m37s
gpt2-85cfd5b6d5-65wg4         1/1     Running   0          22s
gpt2-85cfd5b6d5-kh9j4         1/1     Running   0          22s
gpt2-85cfd5b6d5-pdg5m         1/1     Running   0          22s
Similarly, if you decrease the volume of inference requests, for example, reducing the number of client to one replica, HPA reduces the number of the Triton servers to one replica accordingly after a few minutes:
$ kubectl get pods
NAME                            READY   STATUS    RESTARTS   AGE
client-gpt2-cb4bf7b74-6g82l   1/1     Running   0          11m
gpt2-85cfd5b6d5-65ftt         1/1     Running   0          19m
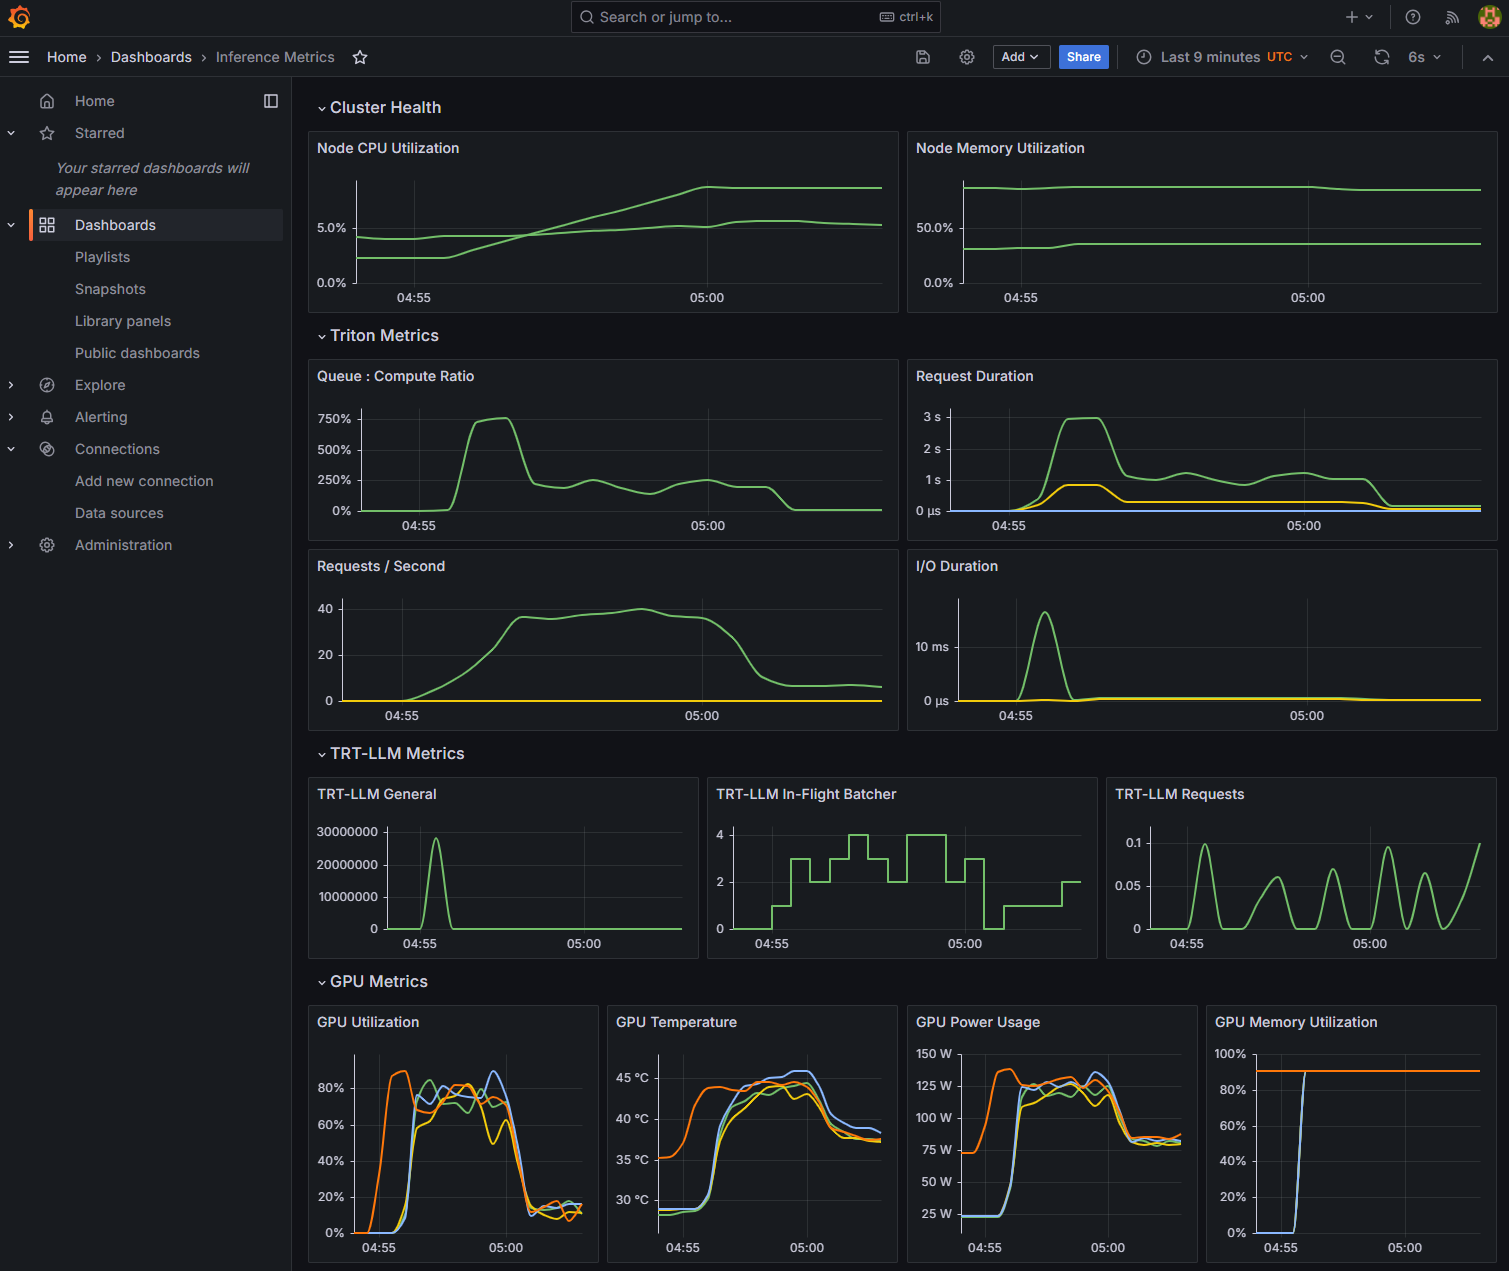
You can also use Grafana to query NVIDIA Triton metrics and your custom metric, visualizing the results in time series by navigating to its metrics endpoint: localhost:8080.
Figure 2 shows the GPU Utilization and Queue:Compute Ratio reflecting this change. At the beginning, only one replica of the Triton server was running on one GPU. As a result, the GPU utilization (orange line) and Queue:Compute Ratio increased while the inference requests were increased significantly by the number of clients.
To reduce the custom metric, HPA increased the number of Triton servers to four replicas running on four GPUs, as shown by the four lines in the GPU Utilization, which reduced the Queue:Compute Ratio efficiently. In the end, the volume of inference requests reduced to one client, so the GPU utilization reduced accordingly.
Get started
This post provides step-by-step instructions for deploying LLMs and autoscaling the deployment in a Kubernetes environment. LLMs can be optimized using NVIDIA TensorRT-LLM, then deployed using NVIDIA Triton Inference Server. Prometheus collects the Triton metrics and communicates with Kubernetes. HPA can use a custom metric to autoscale the Pod numbers, depending on the amount of inference requests from clients.
Ready to get started? Visit triton-inference-server / tutorials on GitHub. Learn more about Triton with TensorRT-LLM. Docker containers can be pulled from NGC if you want to make your own customized image.
To learn how to autoscale LLMs on multinodes with Triton and TensorRT-LLM on AWS, see Scaling your LLM inference workloads: multi-node deployment with TensorRT-LLM and Triton on Amazon EKS.
