
When I profile MPI+CUDA applications, sometimes performance issues only occur for certain MPI ranks. To fix these, it’s necessary to identify the MPI rank where the performance issue occurs. Before CUDA 6.5 it was hard to do this because the CUDA profiler only shows the PID of the processes and leaves the developer to figure out the mapping from PIDs to MPI ranks. Although the mapping can be done manually, for example for OpenMPI via the command-line option --display-map, it’s tedious and error prone. A solution which solves this for the command-line output of nvprof is described here http://www.parallel-computing.pro/index.php/9-cuda/5-sorting-cuda-profiler-output-of-the-mpi-cuda-program . In this post I will describe how the new output file naming of nvprof to be introduced with CUDA 6.5 can be used to conveniently analyze the performance of a MPI+CUDA application with nvprof and the NVIDIA Visual Profiler (nvvp).
Profiling MPI applications with nvprof and nvvp
Collecting data with nvprof
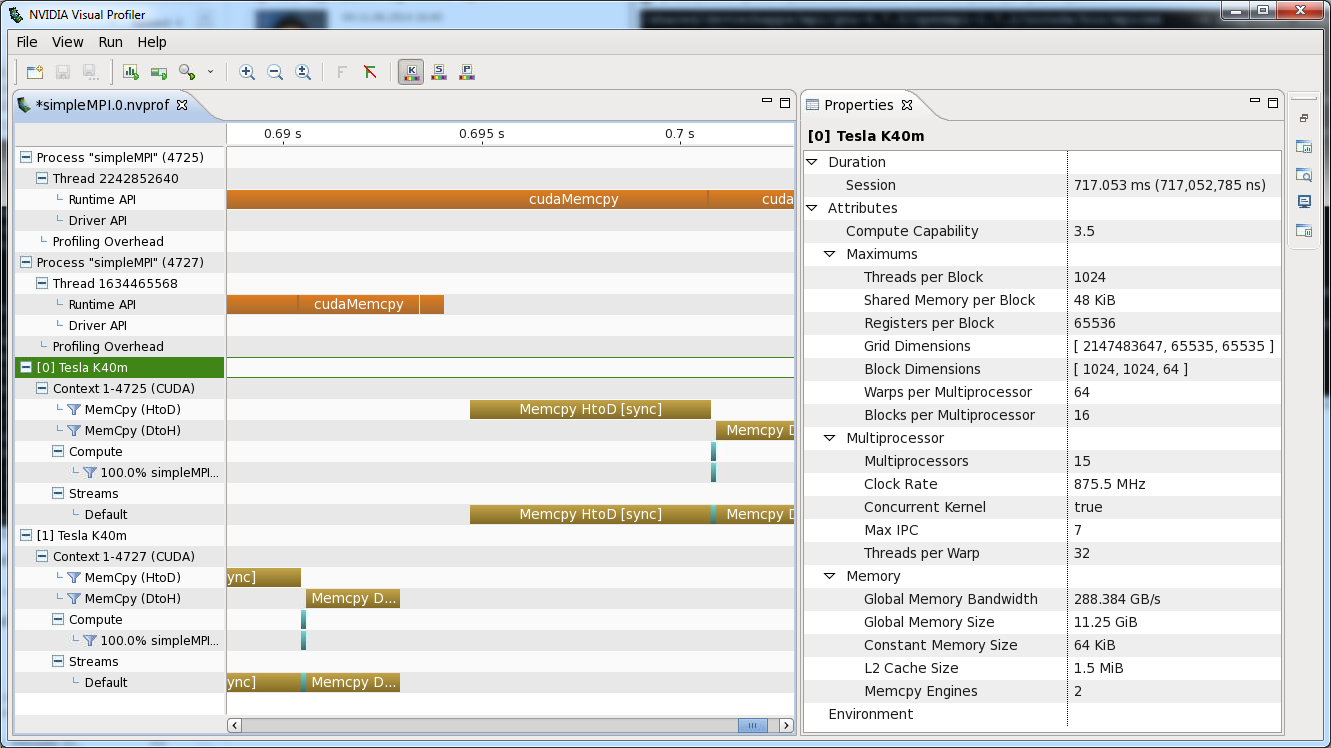
nvprof supports dumping the profile to a file which can be later imported into nvvp. To generate a profile for a MPI+CUDA application I simply start nvprof with the MPI launcher and up to CUDA 6 I used the string “%p” in the output file name. nvprof automatically replaces that string with the PID and generates a separate file for each MPI rank. With CUDA 6.5, the string “%q{ENV}” can be used to name the output file of nvprof. This allows us to include the MPI rank in the output file name by utilizing environment variables automatically set by the MPI launcher (mpirun or mpiexec). E.g. for OpenMPI OMPI_COMM_WORLD_RANK is set to the MPI rank for each launched process.
$ mpirun -np 2 nvprof -o simpleMPI.%q{OMPI_COMM_WORLD_RANK}.nvprof ./simpleMPI
Running on 2 nodes
==18811== NVPROF is profiling process 18811, command: ./simpleMPI
==18813== NVPROF is profiling process 18813, command: ./simpleMPI
Average of square roots is: 0.667279
PASSED
==18813== Generated result file: simpleMPI.1.nvprof
==18811== Generated result file: simpleMPI.0.nvprof
Analyzing profiles with nvvp
The output files produced by nvprof can be either read by nvprof to analyze the profile one rank at a time (using --import-profile) or imported into nvvp. Since CUDA 6 it’s possible to import multiple files into the same time-line as described here. This significantly improves the usability of nvvp for MPI applications.
Enhancing profiles with NVTX
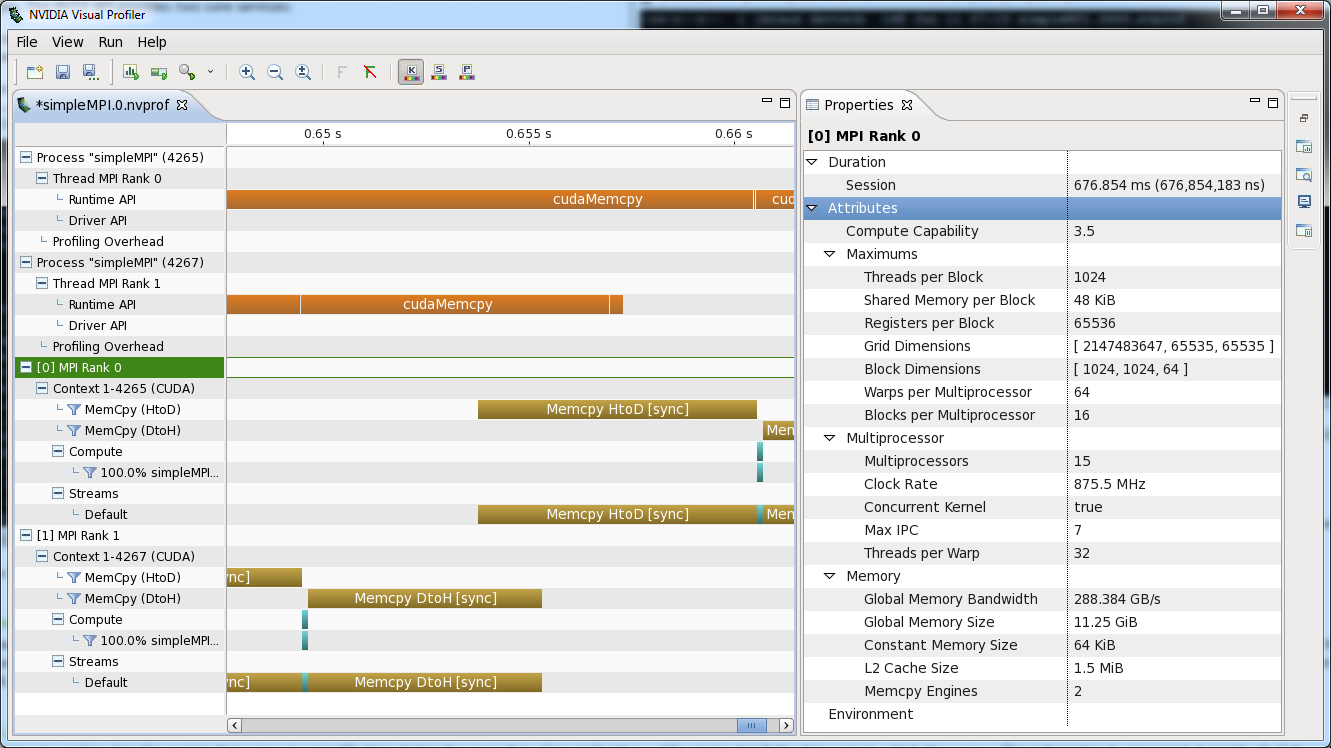
The analysis process can be further improved by using NVTX and naming the CPU threads and CUDA devices according to the MPI rank associated to them. With CUDA 7.5 you can name threads just as you name output files with the command line options --context-name and --process-name, by passing a string like “MPI Rank %q{OMPI_COMM_WORLD_RANK}” as a parameter. Before CUDA 7.5 you can achieve the same result by using NVTX explicitly from your application:
char name[256];
sprintf( name, "MPI Rank %d", rank );

nvtxNameOsThread(pthread_self(), name);
nvtxNameCudaDeviceA(rank, name);
Instead of naming the CUDA devices it’s also possible to name the GPU context:
char name[256];
sprintf( name, "MPI Rank %d", rank );
nvtxNameOsThread(pthread_self(), name);

CUcontext ctx;
cuCtxGetCurrent( &ctx );
nvtxNameCuContextA( ctx, name );
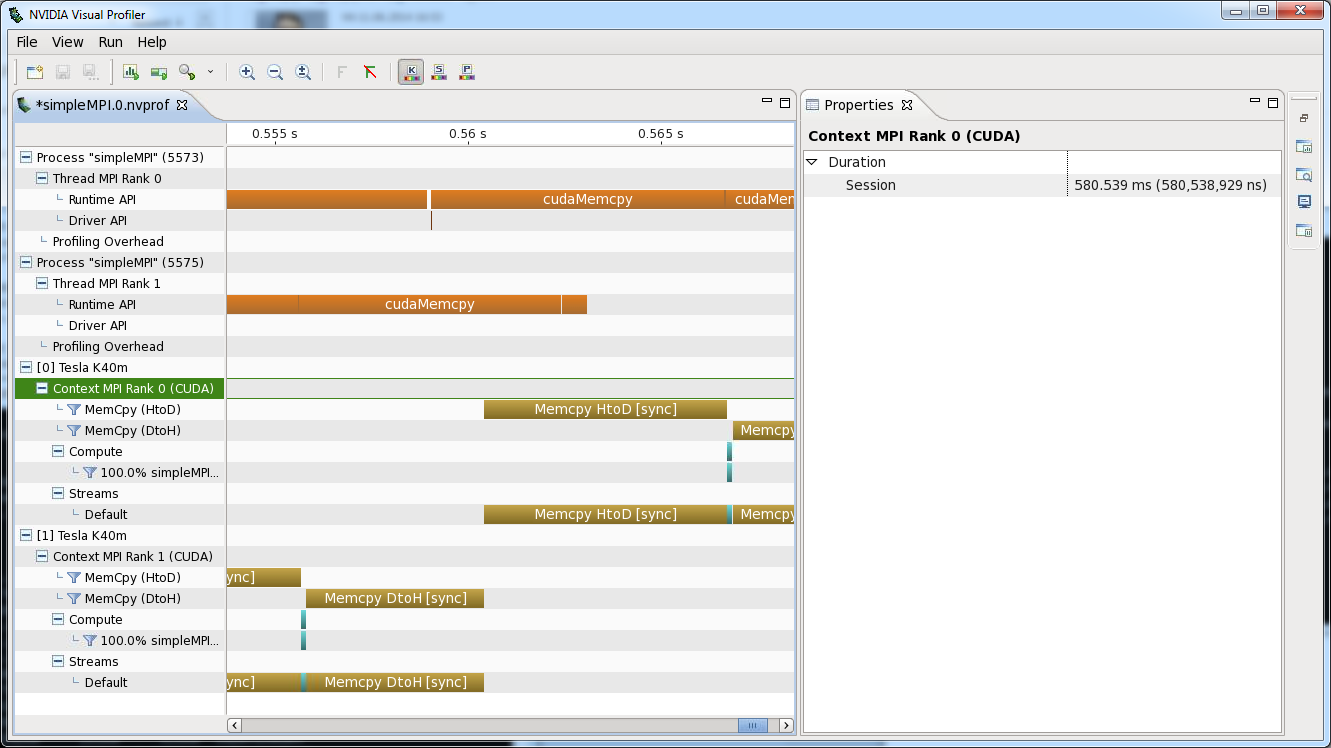
To guarantee that cuCtxGetCurrent picks the right context, it’s required that a CUDA Runtime call is made between the calls to cudaSetDevice and cuCtxGetCurrent.
Other Tools
To collect application traces and analyze the performance of MPI applications, well established and much more sophisticated tools like Score-P, Vampir or TAU exists. These tools use our profiling interface CUPTI to assess MPI+CUDA applications and also offer advanced support to detect MPI and CPU related performance issues.
Conclusion
Following the above approach many performance issues of MPI+CUDA applications can be identified with NVIDIA tools and NVTX can be used to improve working with these profiles. Besides the NVTX resource naming, everything described here works equally well with MPI+OpenACC applications.