NVIDIA Nsight Graphics 1.0 is now available for download for members of the NVIDIA Registered Developer Program.
Nsight Graphics is a suite of debugging and profiling tools for graphics applications, providing understanding of your application’s operation and insight to achieve optimal performance. Nsight Graphics is built with many of the same tools as Nsight Visual Studio Edition, with a few unique tools of its own, yet is delivered as a standalone application for developers who prefer working outside of the Visual Studio environment.
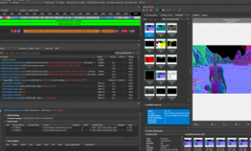
The screenshot shows the advanced features of Nsight Graphics while debugging Ninja Theory’s Hellblade: Senua’s Sacrifice, a Direct3D 11 game based on Unreal Engine 4.
Here’s what comes with the new NVIDIA Nsight Graphics 1.0 release:
- Frame Capture with Live Analysis for instantaneous viewing of all events that compose your frame
- Scrub with the Nsight Graphics Scrubber to see individual draw calls.
- See a detailed Event List of all calls and arguments your application made in frame
- Identify API Statistics to search for common API usage.
- Explore API state at each event with a API Inspector.
- Range Profiling that provides instant GPU throughput analysis
- Identify expensive GPU workloads using time-based range selector scaling
- View and compare any GPU metrics with user configurable graphs
- Select the counters most applicable to your profiling with the User Metrics Selector
- Capture a frame to an independent C++ Capture project for isolated analysis
- Utilize a repeatable, instrumentable project for tuning, experiments, or archival.
- Use the Nsight Graphics build commands to build the project with one click.
- Execute the project in a standalone way or connect the application to Nsight Graphics for follow-up study.
- Explore resources with the Resources View
- Select from a pictorial representation of all of your application’s images to identify resources of interest.
- Graphics, Sparse-Texture, and Memory views are provided.
- Individually view all automatically identified resource revisions.
- Tag a resource’s consumptions to scrub the events on which a resource was used.
- Filter by name, usage, description, memory, views.
- Use a built-in histogram to scale or bucketize a resource’s display.
- Use Pixel History to see the events that contributed to a pixel
- All fragments are identified, even those that failed or were discarded.
- See the individual contributing fragment color and depth.
- Use the VR Inspector to VR state and resources
- OpenVR and the Oculus SDK are supported.
- Leverage API-Specific tools
- View descriptor heaps and root parameters in D3D12.
- Create an Nsight Graphics Project
- A project maintains the history of all launched applications and arguments, allowing for easily switching between them.
- Save all collected documents and reports within the project.
- The Project Explorer is a searchable, sortable, tool for viewing documents and reports. Add non-Nsight Graphics files as well for reference.
- Launch a Remote Session
- Perform experimentation on a dedicated test machine.
- Share hardware configurations across your organization.
For an overview of Nsight Graphics and access to resources, please visit the main Nsight Graphics page.
Check out the features and download it today!
