Today, weather agencies and other organizations such as wind farms, airports, logistic centers, marine operations and many others run customized weather forecasts on complex computing clusters across multiple nodes.
The problem with this approach is that clusters pose a set of challenges including multiple operating systems, shared file systems, and complicated management operations.
To help make weather forecasting more accessible, researchers from the Swiss Federal Office of Meteorology and Climatology, and MeteoSwiss developed a weather forecasting model that can run on a single NVIDIA DGX-2 supercomputer and achieve the same performance as a cluster.
The algorithm, named COSMO, runs a 1000 domain dataset from MeteoSwiss with 287 million grid cells on one DGX-2.
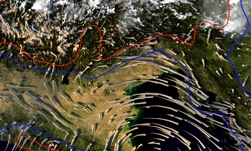
The visualization above is using the open-source visualization tool called ParaView that’s been recently enhanced with ray tracing capabilities using OptiX to take advantage of the latest Turing GPUs The flow visualization shows the wind between high pressure and low pressure areas.
Those attending Supercomputing 18 can see a live interactive demo of the simulation at the NVIDIA booth.
Read more>