Storytelling with data is a crucial soft skill for AI and data professionals. To ensure that stakeholders understand the technical requirements, value, and impact of data science team efforts, it is necessary for data scientists, data engineers, and machine learning (ML) engineers to communicate effectively.
This post provides a framework and tips you can adopt to incorporate key elements of data storytelling into your next presentation, pitch, or proposal. It aims to accomplish the following:
- Introduce storytelling within the context of data science and machine learning
- Highlight the benefits of effective storytelling for data science practitioners
- Provide tips on how to cultivate data storytelling skills
What is storytelling with data
Data storytelling is the ability to add contextual information to key data and insights to help develop viewpoints and realizations for project stakeholders. Data scientists and AI practitioners must effectively convey the impact of data-driven action or reasoning.
Data and machine learning practitioners can use data storytelling to more effectively communicate with clients, project stakeholders, team members, and other business entities. A compelling narrative can help your audience understand complex concepts and can help win new projects.
Data storytelling case study
This section explores the key structural components of a data-driven story.
The article, What Africa Will Look Like in 100 Years, leverages data and visualizations to tell a narrative of the ongoing transformation occurring in Africa from the viewpoint of major African cities such as Lagos, Dakar, and Cairo.
The strategic composition of this article presents the problem, background, and solution. This approach provides a strong foundation for any data-driven narrative. The article also includes facts, anecdotes, data, and charts and graphs. Together, these produce a free-flowing, well-structured, engaging, and informative account of the subject matter.
The opening sections of this article describe the context and main point: “Can Africa translate its huge population growth into economic development and improved quality of life?”
Information such as key dates, figures, and first-person statements create a picture grounded in reality, allowing the reader to form a full understanding of the subject matter. The presentation of data using charts and graphs allows for the visualization of Africa’s major cities transformations. Specific data points include population growth, education rate, and life expectancy. Personal experiences and first-hand accounts from citizens of the focus cities provide additional context.
An effective framework for storytelling in data science
This section explores how storytelling in the data science field should be structured and presented. The goal is to equip you with an easy-to-follow framework for your next presentation, article, or video to stakeholders.
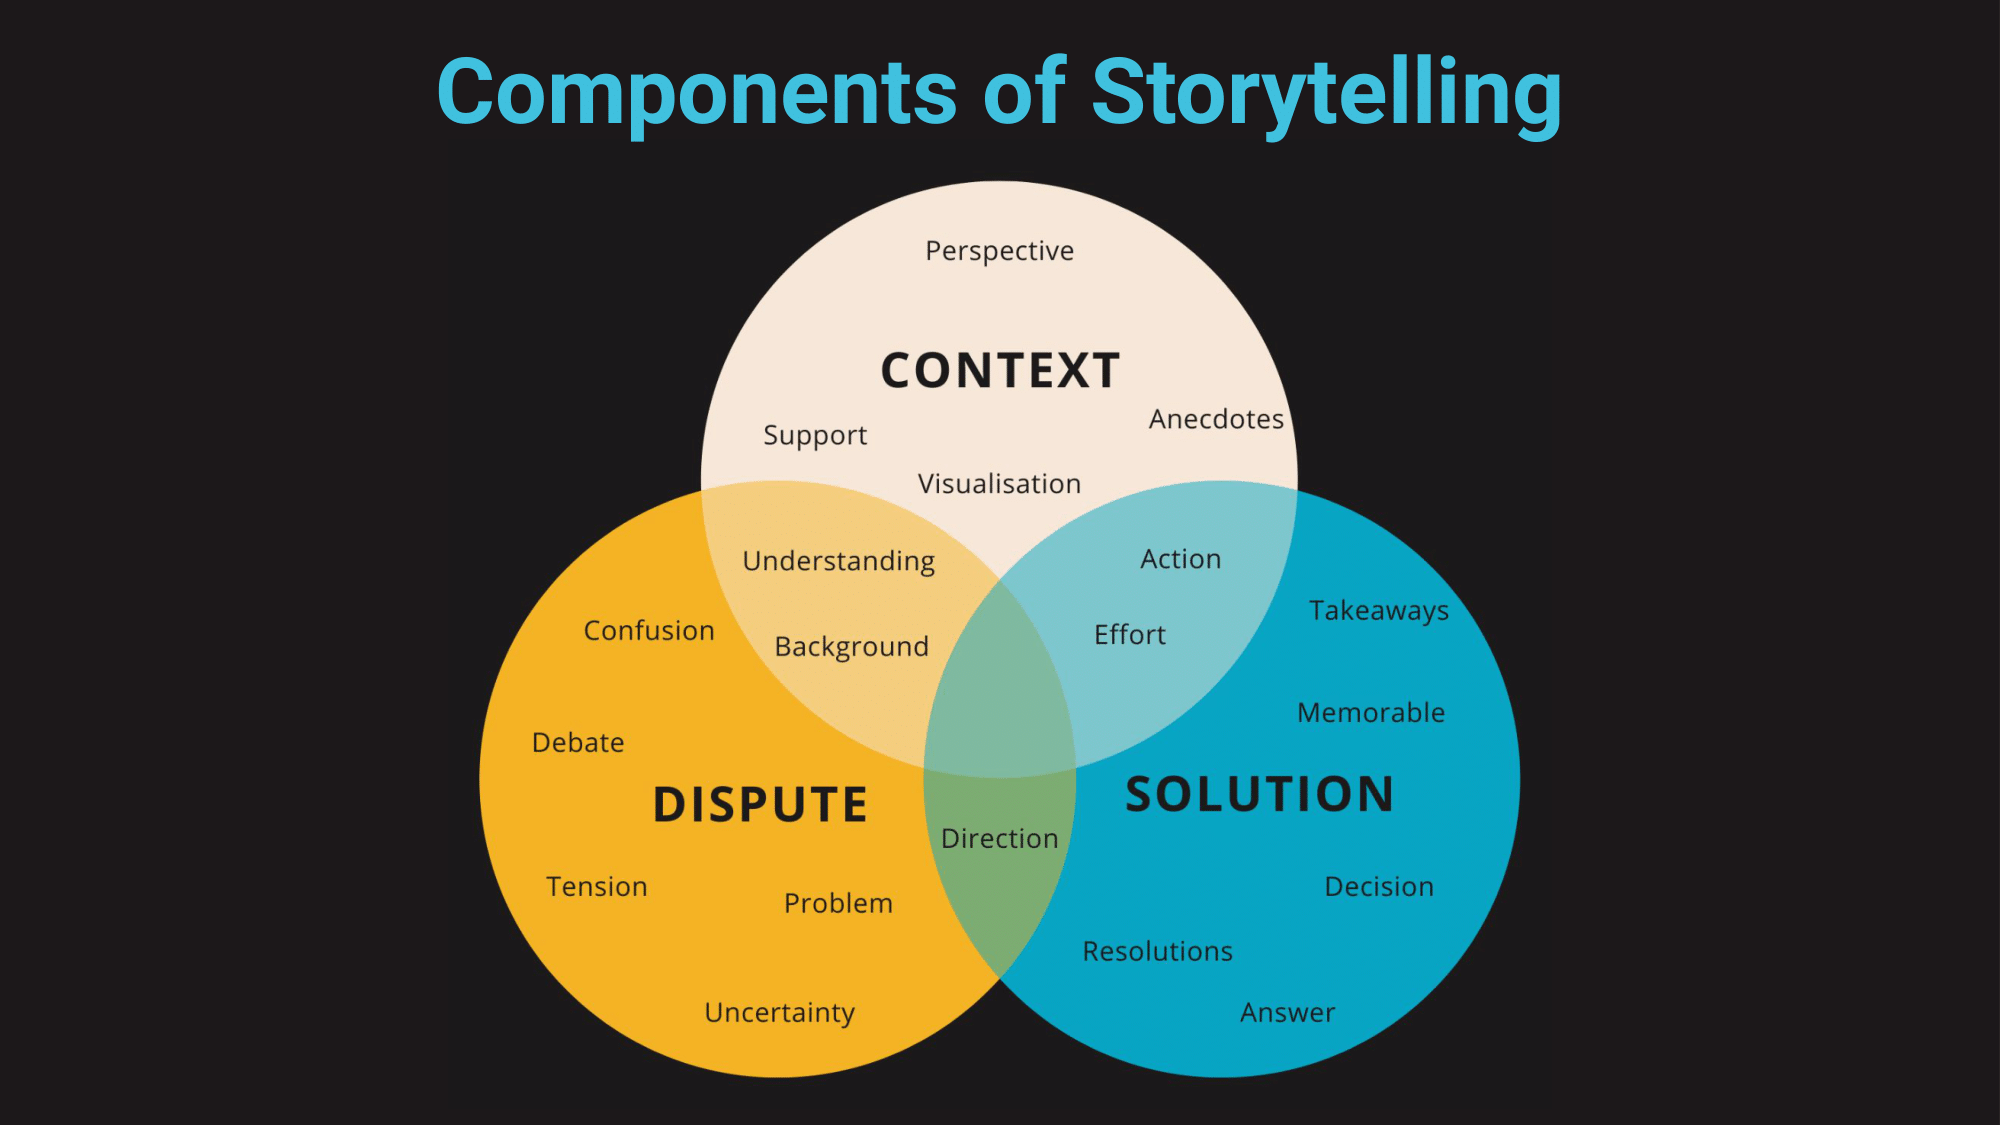
The recipe for success when storytelling can be distilled into three individual components: context, dispute, and solution (Figure 1). These components can be combined with other methods to tell a compelling story with data.
- Context: Lay the foundation for your narrative and provide some background
- Dispute: Discuss the problem associated with the context
- Solution: Explain and discuss the solution that either ends or mitigates the identified problem

Context
In storytelling, context involves providing information to reinforce, support, and reveal the key findings extracted from data samples. Without context, collated data are only collections of alphanumeric representations of information that alone don’t provide any actionable insight into the issue or topic. Presenting data together with reinforcing context and other supporting elements can aid understanding and help audiences reach meaningful conclusions.
You can use many different methods to create context when storytelling. A context within data is produced by leveraging a collection of reinforcing materials such as actors, anecdotes, visualization, data labels, diagrams, and more.
To provide an example, consider the sentence below:
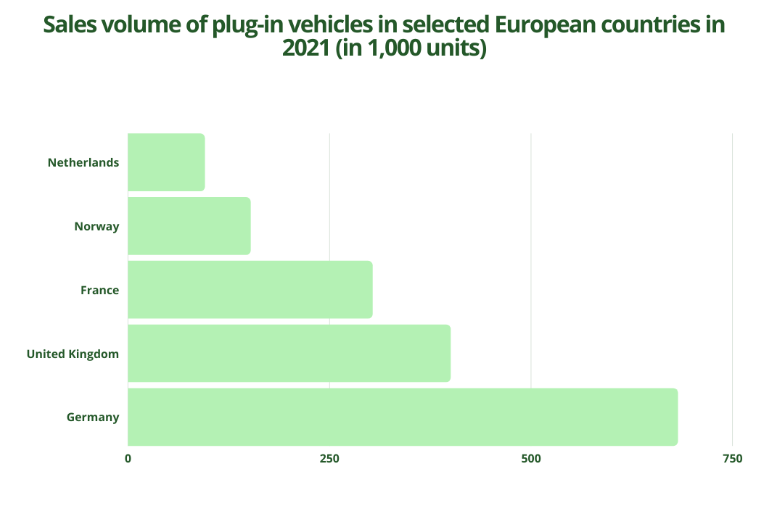
“200,000 plug-in electric vehicles were sold in the United Kingdom in 2021, representing an approximate 140% year-on-year increase.”
Adding contextual information and supporting anecdotes can increase relatability, as shown in the paragraph below:
“James’s interest in electric vehicles was sparked by a conversation he overheard on the radio about climate change. He did some research and found that a Volkswagen ID.3 would be a great choice for him. James decided to buy the car and by mid-2021, he was one of the many UK residents who had made the switch to electric vehicles. Sales of electric vehicles in 2021 more than doubled what they were in 2020, due to the public’s increasing awareness of climate change and its effects.”
Charts and diagrams are also important to include. They visualize data to aid understanding and provide additional support (Figure 2).
Dispute
Dispute, in the context of data storytelling, is a problem, conflict, argument, debate, or issue. To drive the impact of introducing a new tool or adopting a new methodology, it helps to include mention of the key dispute.
Below is an example of a dispute that helps drive the point of the initial electric vehicle data:
“The United Kingdom is a net importer of fossil fuels for the use of energy and electricity generation. Fossil fuels power our transportation, electrical, and technological services, and even domestic items heavily reliant on fossil fuels’ energy output. The problem is that the UK is determined to significantly reduce its dependence on fossil fuels by 2050. Hence, the question is how the UK can reduce its fossil fuel consumption and move to low-carbon energy sources as an alternative. In addition, fossil fuels are a massive contributor to climate change and extreme weather.”
Solution
The third, and final element to consider when connecting storytelling with data is the solution. The solution can come in many forms, such as reconfiguring an existing system, implementing new methodologies, or becoming aware of educational materials and how to best use them.
The proposed solution should be direct, obvious, and memorable. If proposed solutions are ambiguous, stakeholders will ask more questions. A direct solution, on the other hand, allows for action and the formation of future steps.
Below is an example of a proposed solution:
“Awareness is the first step to making the national UK goal of reducing fossil fuel dependency by 2050. To reach more people like James, we propose a scale-up of the WWF Carbon footprint app to include AI-powered functionality that enables services such as energy consumption prediction per household based on historical data and predicted energy demands. This scale-up initiative will require funding of £100 million and will be delivered to the public a year after project approval.”
The proposed solution contains a reference to the story to make it easier to remember. It also includes information about the project cost and timeline to show that it is direct.
Sample outline
Use the sample outline below as a reference for your next data storytelling project.
Opening section
- Start with a factual statement of your key data point or dataset summary that highlights the impact of the dispute, lack of solution, or the impact of a possible solution. For example, “305,300 plug-in electric vehicles were sold in the United Kingdom in 2021, representing an approximate 140% year-on-year increase.”
- Expand on the initial opening section by including several paragraphs introducing, explaining, and expanding on the context.
Middle section
- Introduce, explain, and expand on the dispute.
- Include anecdotes, facts, figures, charts, and diagrams to contextualize the dispute and present the problem.
- Introduce, explain, and expand on the dispute concerning the solution.
- Include anecdotes, facts, figures, charts, and diagrams to illustrate the impact and value of the proposed solution.
Closing section
- Summarize your main points. Show the benefits a solution would bring, and the undesired consequences of not having a solution.
- Include a call to action as a next step that encapsulates the desired outcome of the story told with data.
Summary
Companies and organizations are becoming more data-driven every day. As a result, AI and data professionals of all levels need to develop data storytelling skills to bridge gaps of understanding related to technicalities, datasets, and technologies. The information in this post will give you a strong foundation from which to start building your data storytelling skills.
