Nsight Visual Studio Edition 2019.2 New Features

Next-Gen CUDA Debugger with PTX+SASS source code correlation showing the state at a kernel breakpoint
NVIDIA® Nsight™ Visual Studio Edition 2019.2 is now available with these features and improvements:
Graphics Debugging
-
Range Profiler keeps getting better
- Vulkan support — Inspect GPU performance metrics for whole perfmarker regimes, render passes, and single events
- DXR BuildRayTracingAccelerationStructure calls can now be profiled
- New Range Profiler Preview
- Configure sections to customize the profiling experience
- Introduce rules to create warnings based on GPU performance counter values within the configurable Range Profiler
- Configure camera speed and camera orientation
- Visualize geometry setup flags by utilizing highlight-based filtering
- AABB and bounding box visualization
- Event number and performance markers are now visible in the API Inspector for greater event context
- Trimmed Direct3D 11 and Direct3D 12 strings in the API Inspector to increase information density
Compute Debugging and Analysis
-
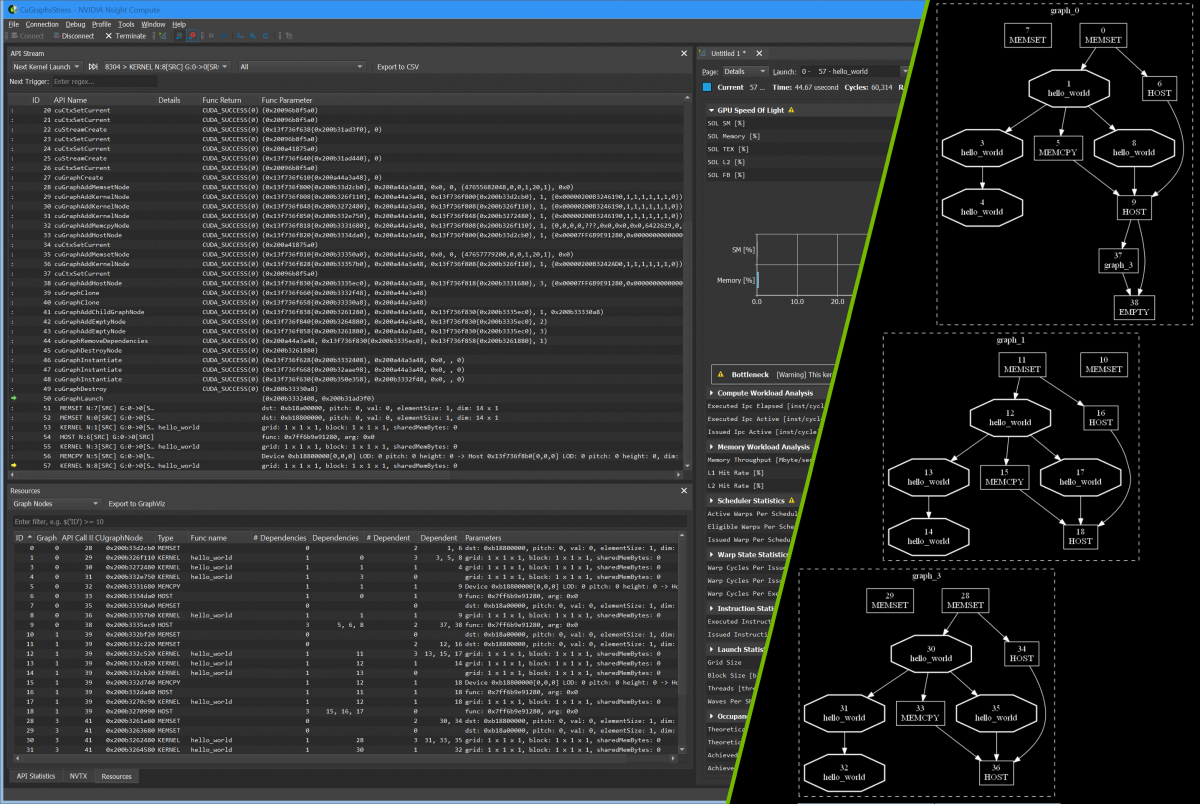
Nsight Compute Debuggers
- Supports CUDA Toolkit 10.1 Update 1
- Works with the latest Turing GPUs
- Improved support for Visual Studio 2019
- Warp Info improvements
- Supports CUDA Toolkit 10.1 Update 1
- Works with the latest Turing GPUs
- Improved performance and bug fixes
- Kernel launch context and stream are reported as metrics
- PC sampling configuration options are reported as metrics
- The default base port for connections to the target changed
- Section files support multiple, named Body fields
- NvRules allow users to query metrics using any convertible data type
- Support for filtering kernel launches using their NVTX context
- Support for new options to select the connection port range
- The Profile activity supports configuring PC sampling parameters
- Sections on the Details page support selecting individual bodies
- Added support for the following additional profiling options:
- Clock Control
- Metrics
- Enable NVTX Support
- Disable Profiling Start/Stop
- Enable Profiling From Start
- Support for stepping to kernel launches from specific NVTX contexts
- Support for new --port and --max-connections options
- Support for new --sampling-* options to configure PC sampling parameters
- Section file errors are reported with --list-sections
- A warning is shown if some section files could not be loaded
-
General
For a complete overview of all Nsight™ Visual Studio Edition features and access to resources, please visit the main Nsight™ Visual Studio Edition page.
NVIDIA® Nsight™ Visual Studio Edition 2019.2 is available for download under the NVIDIA Registered Developer Program.

