The rapid advancements in AI have resulted in an era of exponential growth in model sizes, particularly in the domain of large language models (LLMs). These models, with their transformative capabilities, are driving innovation across industries. However, the increasing complexity and computational demands of training such models necessitate a meticulous approach to optimization and profiling.
Despite the excitement surrounding generative AI and LLMs, the underlying infrastructure and optimization strategies often remain overlooked. Training these models requires not only vast compute resources but also careful tuning of hyperparameters, efficient code execution, and robust profiling mechanisms to ensure scalability and cost-effectiveness.
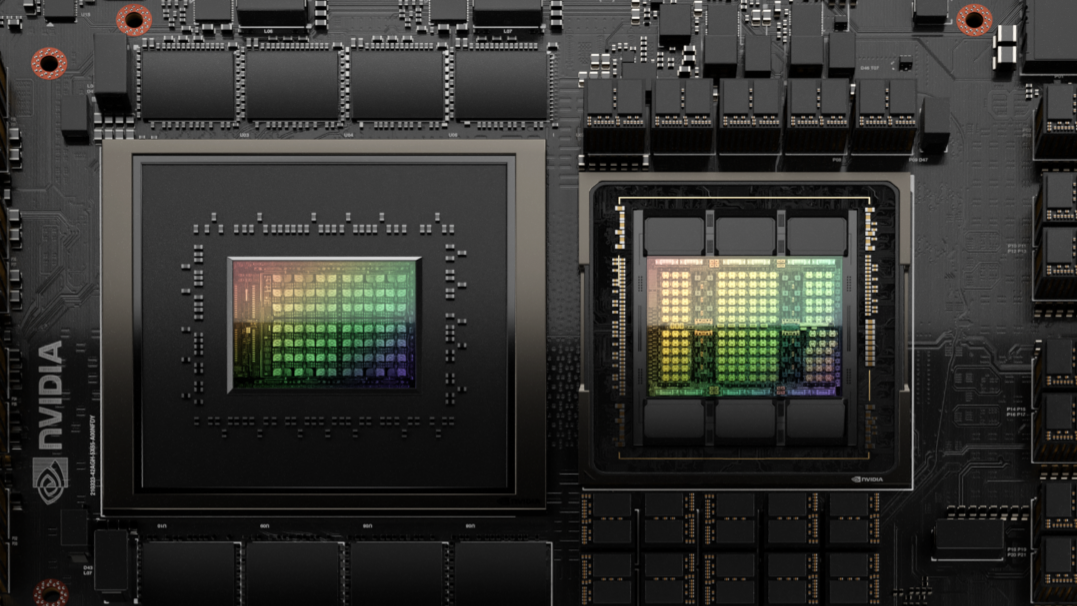
The NVIDIA GH200 Grace Hopper Superchip represents a paradigm shift in AI hardware design. With its innovative CPU-GPU integration and high-bandwidth memory architecture, it groundbreaking solutions for LLM training challenges. By combining NVIDIA Hopper GPUs with NVIDIA Grace CPUs through NVLink-C2C interconnects, this architecture minimizes bottlenecks and maximizes throughput, making it a compelling choice for next-generation AI workloads.
This post explores the critical aspects of profiling LLM training workflows running on NVIDIA Grace Hopper architecture, leveraging NVIDIA Nsight Systems as a powerful tool for performance analysis. It provides a comprehensive guide for researchers and engineers working on LLM training workflows. It emphasizes the importance of profiling tools like NVIDIA Nsight Systems to identify bottlenecks and optimize performance. Additionally, it explores key considerations when interpreting profiling data and offers insights into leveraging advanced hardware platforms like Grace Hopper for efficient training processes.
Exponential growth of LLMs
The evolution of LLMs has been marked by an unprecedented increase in model sizes. From GPT-2 to Llama 4 and beyond, the number of parameters has grown exponentially, enabling these models to achieve remarkable feats in a multitude of generative AI tasks. However, this growth comes with significant computational challenges. Training state-of-the-art LLMs often requires thousands of GPUs working in parallel for extended periods, consuming vast amounts of compute resources.

The sheer scale of these models necessitates innovations not only in algorithm design but also in hardware architecture. NVIDIA Hopper GPUs have emerged as a cornerstone for LLM training due to their advanced Tensor Cores and transformer engines optimized for mixed- and low-precision calculations. These features enable models to perform faster computations without compromising accuracy, addressing one of the key bottlenecks in large-scale AI training.
Given the exponential growth in computational requirements, profiling becomes an indispensable tool for optimizing workflows. It enables researchers to analyze resource utilization, identify inefficiencies, and make informed decisions about hardware allocation and software tuning. Nsight Systems provides a system-level view of application performance, enabling users to trace execution timelines, pinpoint bottlenecks, and optimize code for better scalability.
Prepare the environment for LLM workflow profiling
Follow the steps presented in this section to prepare the environment for profiling your LLM fine-tuning workflow.
Step 1: Pull the NVIDIA NeMo image
Start by pulling the NVIDIA NeMo image optimized for NVIDIA GH200 systems. This image contains all necessary dependencies for running experiments efficiently.
Singularity:
singularity pull nemo:25.02.sif docker://nvcr.io/nvidia/nemo:25.02.01
Docker:
docker pull nvcr.io/nvidia/nemo:25.02.01
Step 2: Allocate resources
Use the salloc command to grab a node in interactive mode. Note that this example uses a SLURM based-environment:
salloc -n 1 -N 1 -p gh -t 2:00:00
Step 3: Run the singularity container
Launch the NeMo nightly image inside your interactive session.
Singularity:
singularity run --nv nemo:25.02.sif
Docker:
docker run nvcr.io/nvidia/nemo:25.02.01
Step 4: Download required components
Inside the container, download the following:
- Llama 2 7B model for fine-tuning
databricks-dolly-15kdataset for fine-tuning- NeMo framework required to execute your experiments
Profiling fine-tuning workflows with Nsight Systems
To capture detailed performance data during fine-tuning, use nsys profile with specific switches tailored to this workload:
- Set profiling duration:
nsys profile -y 360sets the profiling duration to 360 seconds (6 minutes) - Delay profiling start:
nsys profile -d 720delays profiling by 720 seconds (12 minutes), which allows skipping initial setup phases to focus on profiling the main workload - Trace CUDA libraries:
nsys profile --trace=cuda,cudnn,cublasmonitors CUDA operations, cuDNN kernels, and cuBLAS calls - Specify output file:
nsys profile -o sft_llama2_7Bnames the output filesft_llama2_7B.nsys-rep
After enabling the NeMo framework container and setting environmental variables, launch the fine-tuning job on the interactive node:
nsys profile -y 360 -d 720 \
--trace=cuda,cudnn,cublas,osrt,nvtx \
--event-sample=system-wide \
-w true -c cudaProfilerApi -o sft_llama2_7B \
python ...
Analyze the first profiling session with Nsight Systems
After running the profiling session as described, the next step is to analyze the captured data. Nsight Systems provides a rich visual interface for understanding the performance characteristics of your application.
First, copy the .nsys-rep file from the Grace Hopper machine to your local workstation. Then, simply drag and drop the file onto the Nsight Systems window to load it. The main view this example focuses on is the timeline view, which presents a detailed breakdown of CPU and GPU activity during the run (Figure 2).

CPU utilization
At the top of the timeline in Figure 2, Nsight Systems visualizes the utilization of all 72 CPU cores on the Grace Hopper machine. The bars represent how busy each core is over time, with consistent activity across all cores suggesting a well-distributed workload. This is crucial for ensuring that your training job is effectively leveraging all available CPU resources.
Processes
Beneath the CPU section, Nsight Systems lists the active processes and threads. In this case, the primary process of interest is python3, which is responsible for running the NeMo framework and our fine-tuning workload. By examining the activity of this process, you can gain insights into its performance characteristics.
CUDA hardware
The CUDA hardware section details GPU activity. You’ll be able to see CUDA kernels. Here, sm90_xmma_gemm_bf16bf16_bf16f32 appears to dominate the kernels executed.
Kernel analysis and memory usage
In the CUDA HW [All Streams] section, you can dissect which kernels are dominating GPU execution time:

Kernels represent the individual computational tasks running on the GPU. In this profiling session, one kernel stands out: sm90_xmma_gemm_bf16f16_bf16f32. This kernel accounts for 49.9% of total GPU time. Its name signifies that it performs matrix multiplications using bfloat16 (BF16) precision, a key operation in deep learning. The dominance of this kernel indicates that matrix multiplication operations are a primary bottleneck in our workflow.
Other kernels, such as elementwise_kernel and vectorized_elementwise_kernel, contribute to element-wise operations, consume smaller portions of GPU time.
Memory usage
The memory usage section reveals that only 0.5% of GPU time is attributed to memory transfers and operations between the CPU and GPU. This low percentage suggests that interconnect bandwidth, such as PCIe or NVLink, is not a significant bottleneck in this specific run. However, it is important to note that this observation specifically relates to the interconnect bandwidth and does not necessarily imply that the kernels themselves are not memory-bandwidth bound.
The workload could still be constrained by the GPU’s internal memory bandwidth, depending on how data is accessed and processed within the device. Based on this profiling data, you can reasonably conclude that interconnect bandwidth is not a limiting factor here, and the workflow appears to be predominantly compute-bound.
Compute-bound versus memory-bound processes
A process is considered compute-bound when its performance is primarily limited by the speed of the processor (CPU or GPU). In this case, the dominance of the sm90_xmma_gemm_bf16f16_bf16f32 kernel confirms that the workflow spends most of its time performing computationally intensive matrix multiplications on the GPU.
A process is memory-bound when its performance is primarily limited by the speed of memory access (reading and writing data) rather than computation. Large-scale data copying algorithms or frequent memory lookups are examples of memory-bound processes.
Analysis of the main thread
Moving on from the global view of GPU kernels and memory usage, this section zooms in on the activity of the primary thread coordinating our fine-tuning workflow: pt_main_thread. This thread is responsible for orchestrating data loading, kernel launches, and communication between different components of the system. Figure 4 shows the timeline view for the main thread.

Overall GPU activity
The prominent green bar at the top represents GPU activity initiated by this thread. While there’s generally high utilization, the presence of gray spaces indicates periods of GPU idleness. These gaps could be derived from various sources, including:
- Delays in data processing on the CPU, causing the GPU to wait for new work.
- Synchronization issues between CPU threads and GPU kernels, resulting in underutilization.
- Insufficient overlap between computation and communication, leading to GPU stalls during data transfers.
CPU threads
Beneath the GPU activity, we see colorful blocks representing the execution of CPU threads. These threads typically handle tasks such as data preparation, model parameter updates, and kernel launches. Analyzing the timing and duration of these CPU tasks can shed light on potential bottlenecks that might be causing GPU idle time.
CUDA memory transfers
The orange bars in the timeline represent CUDA memory transfers between the CPU and GPU. Contrary to what is ideal for deep learning workloads, these transfers appear frequent, indicating that data is being moved between the CPU and GPU often. This could introduce overhead and reduce overall performance, as frequent data movement can slow down training processes. Optimizing data placement to minimize these transfers could significantly improve efficiency.
Insights from the autograd thread
The pt_autograd_0 thread is a key component related to the PyTorch autograd engine. This engine handles automatic differentiation for computing gradients during backpropagation, a fundamental part of the training process.
Examining the activity of this thread within Nsight Systems provides a more refined understanding of GPU and memory usage patterns, synchronization events, and overheads associated with gradient computations (Figure 5).

Decoding the timeline: Color and activity
The timeline exhibits a range of colors and activity patterns, each encoding valuable information:
- Green sections: Represent active computation or execution within the autograd engine. These segments indicate periods when the thread is actively performing calculations related to gradient computation.
- Brown dotted sections: Indicate thread preemption, context switching, or periods where the thread is waiting for resources. These interruptions suggest that the thread’s execution is being paused, potentially due to other higher-priority tasks or resource contention.
pthread_cond_waitblocks: Represent instances where application threads are blocked and waiting for a condition variable to be signaled. As highlighted in the image, these blocks often appear when the CPU is waiting for tasks running on the GPU to finish. This is a crucial observation for optimization.
Optimizing synchronization
Understanding the wait periods is critical for optimizing overall performance. Reducing these pthread_cond_wait occurrences can help improve throughput by ensuring better synchronization between CPU and GPU tasks. Potential strategies include:
- Overlapping computation and communication: Reduce synchronization points by performing computation and data transfer concurrently.
- Optimizing kernel launch parameters: Ensure that the parameters for kernel launches are correctly configured to minimize CPU overhead.
- Analyzing dependencies: Scrutinize the dependencies between different operations to identify any bottlenecks that could be causing unnecessary delays.
A detailed analysis of the pt_autograd_0 thread can reveal critical bottlenecks in the autograd engine, highlighting areas where synchronization and resource utilization can be improved.
Conclusion
This post has explored the critical role of profiling in optimizing LLM training workflows. It provided a detailed look at NVIDIA Nsight Systems profiling techniques that provide a granular view of system performance, from CPU utilization to GPU kernel activity and memory usage.
We analyzed key bottlenecks, such as synchronization delays and idle GPU periods, while highlighting strategies to optimize data loading and computation.
While profiling is essential for identifying inefficiencies, it is only one piece of the puzzle. Advanced optimization techniques like CPU offloading, Unified Memory, Automatic Mixed Precision (AMP), and FP8 training offer additional avenues for enhancing performance and scalability. These methods not only address hardware limitations but also enable researchers to push the boundaries of what’s possible with LLMs.
To learn more, watch the GTC session, Profile Large Language Model Trainings on the Grace Hopper Superchip on demand.
For a deeper dive into these advanced optimization strategies on Grace Hopper, see Advanced Optimization Strategies for LLM Training on NVIDIA Grace Hopper. The related post explores how features like Unified Memory simplify memory management, how CPU offloading can help manage GPU memory constraints, and how precision techniques like AMP and FP8 training can unlock new levels of efficiency.


