
Editor’s Note: Get notified and be the first to download our real-world blueprint once it’s available.
Machine learning techniques attract a great deal of popular attention: it isn’t difficult to find articles explaining how to extract features or train models. But the end-to-end discovery process that produces a usable machine learning system consists of more than mere techniques. Furthermore, solving business problems with data extends beyond machine learning to encompass exploratory data science, business analytics, and scalable data processing.
This is the second installment of a series describing an end-to-end blueprint for predicting customer churn. In this article, we show how reporting and exploratory data analysis fit into discovery workflows and machine learning systems. We also explain how the RAPIDS Accelerator for Apache Spark makes it possible to execute these workloads on NVIDIA GPUs — enabling nearly a 700% speedup on the analytics portion of our churn prediction application.
If you haven’t yet read the first post, in which we described the problem, discovery workflows, and data federation and preparation, check it out first! This post discusses deep learning for recommender systems. The third post will discuss the winning solution, the steps involved, and also what made a difference in the outcome.
Exploratory analysis
The first step in the data science discovery workflow is formalizing the problem we’re trying to solve, which depends on understanding the data and understanding the business. A well-defined problem can help to codify the ways in which our analytics efforts ultimately provide business value (rather than merely achieving excellent model performance metrics). Exploratory analysis can support formalizing the problem, developing these necessary understandings, and more:
- Understanding the business impact of an effective solution is important for prioritizing efforts
- Business context helps practitioners identify finer-grained success criteria.
- Data scientists and business analysts need to define meaningful prediction targets for the models they’ll ultimately be training.
- Better understanding of the data can inspire novel modeling approaches.
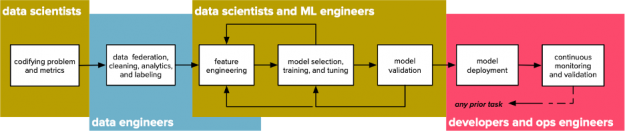
- Exploratory analysis can support the data science workflow’s “inner loop” of feature extraction, model training, and validation, and simulation (see Figure 1).
Prioritizing efforts to maximize business impact
Understanding the business impact of an effective solution is important for prioritizing efforts (not to mention that individual data scientists, like other employees, are interested in avenues to demonstrate the quantifiable impact of their work). While data scientists may take great pride in producing robust, general models with minimal prediction error, the business impact — not merely the predictive power of their models — should guide their efforts, and exploratory analysis is an important tool to identify the extent to which improved predictive performance might affect business metrics.
Tightening success criteria with business context
Business context helps practitioners identify finer-grained success criteria. While any organization wants to treat every customer equally in providing excellent service, it may not want to treat the risk of churn for every customer as equally important to the business. We may thus be interested in ranking churn risks by their expected remaining lifetime account value, by the expected cost to acquire a comparable account, or by other metrics.
Defining meaningful prediction targets
Data scientists and business analysts need to define meaningful prediction targets for the models they’ll ultimately be training. On a long enough timeline, every customer will fail to renew their subscription, but a model that asserts “yes, eventually” for every customer isn’t useful or actionable. A model that exclusively identifies that customers who have recently begun the process to close their accounts are likely to churn is similarly dubious. Exploratory analysis can inform a carefully crafted prediction target by enabling data scientists and analysts to simulate the plausibility and impact of various prediction targets on historical data.
Inspiring novel modeling approaches
Better understanding of the data can inspire novel modeling approaches. For example, two customer attributes may not be strongly correlated with churning individually, but their combination may be. Exploratory analysis can thus inform the process of feature engineering.
Supporting discovery workflows with ubiquitous exploratory analysis
Exploratory analysis can support the data science workflow’s “inner loop” of feature extraction, model training and tuning, and validation and simulation in two ways: directly, by providing summary statistics, domains for categorical features, and distributions for numerical features, and indirectly, by enabling data scientists to disregard uninformative features before training a model and thus making the model and the system built around it more robust.
Business analytics and reporting
While exploratory analysis is a valuable part of the early stages of the data science discovery workflow, similar workloads are important in production and can provide insight and value even without training a model. The main difference between these workloads is one of context: while exploratory analysis is generally ad hoc, business analytics workloads are typically run regularly in production. Techniques or queries used in exploratory analysis may inform or even become parts of automated reporting or analytics workloads.
Analytics in churn modeling
In our blueprint application, we’ll incorporate a pair of analytics workloads. The first workload produces a machine-readable summary report that is — along with the single wide table of customer data we described in the previous installment — part of the input to the model training application. The second workload produces a series of reports intended to help analysts and stakeholders better understand the factors that make customers more likely to renew or churn, in order to guide human decisions in the modeling process as well as to inform business decisions and service offerings that incorporate effective renewal incentives. We’ll now examine each of these in turn.
Calculating feature summaries and domains
Part of understanding our data is understanding each feature individually; this is also a prerequisite to effective feature engineering or model training. Basic summary statistics — like minimum, count, mean, median, variance, and so on — are useful but may insufficient to characterize a dataset alone, since radically different datasets may have similar summary statistics. A famous example of this phenomenon is Anscombe’s Quartet (Figure 2), which is four two-variable datasets that have identical means, variances, correlations, and linear relationships but which exhibit obviously different shapes when plotted.
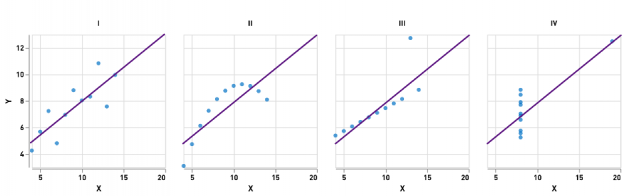
Figure 2: Anscombe’s Quartet, a set of synthetic datasets that have identical summary statistics but different shapes.
In order to more faithfully characterize our datasets, we’ll need to compute more descriptive summaries of individual features in addition to the basic descriptive statistics. One such summary is the cumulative distribution, which can both inform feature engineering decisions and provide valuable business context. For example, in many cases, it is more useful to know that a given customer’s monthly spend is in the 97th percentile than to know that that customer’s monthly spend is two standard deviations above the mean. Apache Spark supports efficient techniques for calculating approximate quantiles of columns in data frames, which we can use to produce cumulative distributions of these values.
We also produce a report including basic summary statistics, such as mean, minimum, maximum, and variance (for numeric features) and the identities and counts of distinct values (for discrete or categorical columns). These statistics and distributions are useful in themselves but will also make the data scientist’s job easier, since they can inform feature encoding approaches.
Exploratory analysis and reporting in churn modeling
The second component of our analytics workload simulates both exploratory analysis and scheduled reporting by producing two kinds of reports:
- A set of data cubes, or multidimensional spreadsheets, showing the counts of customers with combinations of given attributes that churned or renewed, and
- A collection of rollup reports showing the total lifetime account value of every customer that churned in a given quarter.
The data cube reports enable analysts to quickly drill down on a combination of features and see which are most strongly correlated with renewal or churn. It is worth noting that many real-world analytics pipelines may end at this point, since reports like this can provide actionable insight even without a trained predictive model. Figures 3 and 4 show the value of these reports: by drilling down to plot the interaction of a customer’s contract status (month-to-month, annual, or two-year) and their tenure in quarters, we can clearly establish that most of the customers who churn are relatively new and on month-to-month contracts.
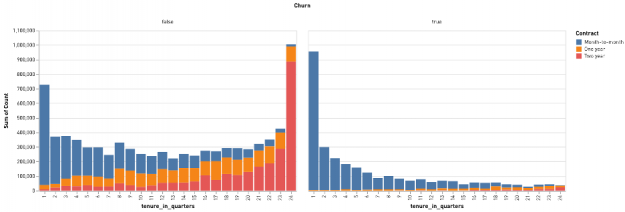
Figure 3: The distributions of a customer’s tenure and contract status for customers who renewed (on the left) and who churned (on the right), demonstrating that new customers on month-to-month contracts represent the majority of churning customers.
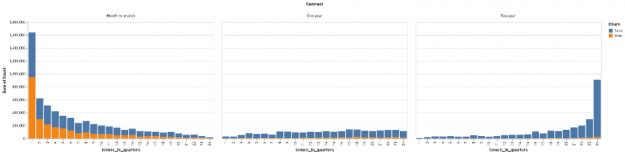
Figure 4: The distribution of renewing (blue) and churning (orange) customers by tenure in quarters, grouped by contract type, from least restrictive (on the left) to most restrictive (on the right).
These figures show another advantage of exploratory analysis and reporting: since some of the features we consider in our summaries are numeric (e.g., months of tenure), we can also use data cube reports to investigate the impact of various quantization or bucketing strategies. Instead of seeing how many customers churned at each discrete month of tenure, for example, we might be more interested in abstracting the tenure of our customers by looking at how many quarters, half-years, or years an account had been active. (In Figures 3 and 4, we bucketed customer tenures by quarter.) Identifying how best to abstract numeric data in order to convey the most information to human stakeholders and to downstream analyses alike is another goal of exploratory analysis.
Performance improvements and future work
In our previous installment, we saw how the RAPIDS Accelerator for Apache Spark could execute data federation workloads on NVIDIA GPUs. While some organizations may execute federation pipelines regularly, others may execute federation pipelines only when the pipelines themselves or the source data materially change. Exploratory analytics and reporting are more performance-sensitive, though: exploratory analytics workloads are typically interactive and human time is precious, and reporting workloads may be batch scheduled but run regularly. These workloads are also typically more complex than data federation workloads and thus also more amenable to performance improvement. By executing our analytics workloads on NVIDIA GPUs with the RAPIDS Accelerator for Apache Spark, we were able to achieve speedups of nearly 700% relative to CPU execution.
In future installments of this series, we’ll provide more details on our overall system as well as show how we improved the performance of our federation and analytics workloads. Stay tuned for more!
