
Machine learning (ML) data is big and messy. Organizations have increasingly adopted RAPIDS and cuML to help their teams run experiments faster and achieve better model performance on larger datasets. That, in turn, accelerates the training of ML models using GPUs. With RAPIDS, data scientists can now train models 100X faster and more frequently. Like RAPIDS, we’ve ensured that our data logging solution at WhyLabs empowers users working with larger than memory datasets.
However, with great power comes great responsibility! ML models are notoriously fickle and model failures are a major pain point that teams experience starting from the moment the model is deployed. Unlike software failures that often stem from bad code and configurations, AI failures can often be attributed to bad data. As the adage says, garbage in, garbage out.
At WhyLabs, we built an open-source library called whylogs to enable a lightweight data monitoring layer throughout the MLOps pipeline at scale. When coupled with whylogs, you can increase your speed while having a unified framework to detect data quality issues and data drift regardless of training data size. The infrastructure-agnostic approach means that anyone using RAPIDS can easily plug whylogs into their workflows with a few lines of code.
Data logging and statistical profiling
In contrast to explicitly defined software, datasets are especially opaque to introspection. However, due to the complexity of these applications, the available tools remain limited and their adoption is much less widespread than standard software logging. Whereas software is fully specified by code and you can easily include precise logging statements to pinpoint issues, datasets and data pipelines require significant analysis to diagnose. whylogs automates the process of collecting and logging important statistical signatures of your model data across all features in a streaming and batch manner. Its small, unified output format with analytics support enables your data science team to quickly respond to data events.
Effective MLOps monitoring involves tracking data distributions and statistics across all stages of your ML pipeline, including development, testing, integration, release, and deployment. Powered by approximate statistical methods, the library can “summarize” terabytes of data into tiny “statistical fingerprints,” which can be as small as a few megabytes. It runs in parallel with AI applications and requires virtually no additional computing power than what is already being used to run the application. The lightweight summaries that whylogs distills are useful to AI builders for troubleshooting. The library can be deployed anywhere in the ML pipeline at any stage of the model lifecycle to track data continuously without breaking the compute and storage budget. For more information, see the whylogs: Embrace Data Logging Across Your ML Systems.
Creating a basic ML model with RAPIDS
For this solution, you can get started with RAPIDS using the cuDF package, which is an accelerated library with a Pandas-like dataframe API that is designed for the GPU.
In this example, you build a simple random forest classifier on the UCI Heart Disease dataset on the GPU. Using a small and simple dataset allows you to understand the underlying procedures of creating a basic model, performing inference, logging relevant data, and exploring the results. For the complete version of this Jupyter notebook, view or download it on GitHub.
import cudf
from cuml.ensemble import RandomForestClassifier
from cuml.metrics import accuracy_score
import whylogs
from whylogs.viz import ProfileVisualizer
cu_heart_data = cudf.from_pandas(heart_data)For simplicity, choose the first 200 rows as training data and the remainder as batches of testing data. In addition to CuDF, you use CuML to train a random forest classifier on the target variable:
cuml_model = RandomForestClassifier(n_estimators=40,
                   max_depth=16,
                   max_features=1.0,
                   random_state=1095)

cuml_model.fit(X_train, y_train)
The GPU requirements scale with the size of the model. For this post, we used a small model for illustration only. On the Tesla T4, with this small (4 KB) dataset, the model trained in 73 milliseconds.
Logging training data with whylogs
Now that you’ve trained a model that needs detection, log the training data as the baseline dataset. You then replicate real-time inference on a small scale by splitting the data into multiple batches to replicate daily runs. This data is also logged—the information contained is crucial for diagnosing model failures and understanding historical trends.
session = whylogs.get_or_create_session()
profile = session.new_profile(dataset_name="cudf-example")
profile.track_dataframe(cu_heart_data)
One output from WhyLogs is a summary object that can be exported as a Pandas dataframe;
summary = profile.flat_summary()["summary"]
summary
On each batch of inference for the model, you should also log the data:
profiles = []

# Model inference
output1 = X_test1.reset_index(drop=True)
output1["pred"] = cuml_model.predict(X_test1)

# Log using WhyLogs
profiles.append(session.profile_dataframe(output1,
        dataset_timestamp=datetime.datetime.now()-datetime.timedelta(days=2)))
Repeat this process for the remaining batches:
# Inference and logging on second batch
output2 = X_test2.reset_index(drop=True)
output2["pred"] = cuml_model.predict(X_test2)
#output2 = output2.to_pandas()
profiles.append(session.profile_dataframe(output2,
        dataset_timestamp=datetime.datetime.now()-datetime.timedelta(days=1)))

# Inference and logging on third batch
output3 = X_test3.reset_index(drop=True)
output3["pred"] = cuml_model.predict(X_test3)
profiles.append(session.profile_dataframe(output3, dataset_timestamp=datetime.datetime.now()))
whylogs implements several useful statistics for data profiling. All statistics are collected in a streaming fashion. Using this approach requires only a single pass over the data with minimal memory overhead and is naturally parallelizable. The resulting profiles are all merge-able, allowing statistics from multiple hosts, data partitions, or datasets to be merged post-hoc. The approach is therefore trivially parallelizable and map-reducible, making it highly scalable. Certain statistics can be tracked exactly, such as record count, data type counts, null count, min, max, and mean. Others—such as quantiles, histograms, or cardinality—require approximate statistics.
Visualizing whylogs data
Finally, whylogs provides tools to easily visualize important characteristics of the data. Here, we show several key features of the data that we’ve captured. For example, it is often necessary to understand the distribution of each input feature and outputs to the model to compare across batches. We also show the unique values plot, which can be an important indicator of data quality issues and model failures.
viz = ProfileVisualizer()
viz.set_profiles(profiles)
viz.plot_distribution("chol")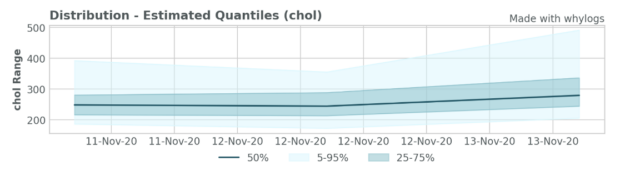
viz.plot_uniqueness("age")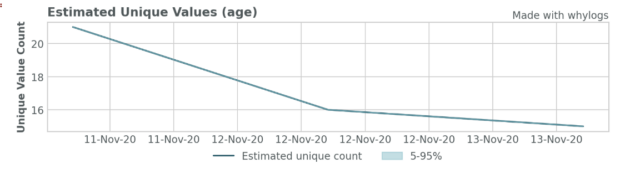
Monitoring your predictions
Our open-source logging library, whylogs, provides even more value when paired with the WhyLabs platform. Using this SaaS platform allows organizations to monitor their models on a system designed specifically for data science workflows. Try the platform now.
Onboarding to the platform is quick and intuitive. It involves deploying an agent like ones that are standard practice in DevOps tools, such as Datadog and Splunk. Because the platform runs on statistical profiles generated by whylogs, raw data never leaves the customer perimeter. This design makes our platform well-suited for customers with highly sensitive data.
Getting started
- The library is open-source and available in both Python and Java, with Apache Spark and MLFlow integrations. There are more to come! Give us a shout for your favorite frameworks!
- For implementation details and the range of applications, see whylogs: Embrace Data Logging Across Your ML Systems.
- We also recommend that you see Managing and Deploying High-Performance Machine Learning Models on GPUs with RAPIDS and MLFlow, and learn how you might combine using whylogs with MLFlow to enhance visibility and trust in your MLOps pipeline.
- Stay tuned with further development by joining our Slack channel.
