
AI has seamlessly integrated into our lives and changed us in ways we couldn’t even imagine just a few years ago. In the past, the perception of AI was something futuristic and complex. Only giant corporations used AI on their supercomputers with HPC technologies to forecast weather and make breakthrough discoveries in healthcare and science.
Today, thanks to GPUs, CPUs, high-speed storage, and AI-optimized software innovations, AI is accessible to everyone. You can even deploy AI in the cloud as a service (SaaS) or as an infrastructure (IaaS).
We’ve witnessed the widespread use of AI in every industry: healthcare and financial, self-driving cars, ad recommendations, and most recently generative AI that creates and edits content such as videos, images, and music. With the recently introduced ChatGPT-4 that uses large language models (LLMs) to understand, respond, and even generate text like a human, it’s exciting to think about the limitless potential of what we could achieve.
Getting the most out of your AI requires more than just expensive high-end GPUs and storage systems. A robust and reliable network with groundbreaking performance is essential to unleashing the full potential of your AI infrastructure, enabling shorter job completion time (JCT), faster training, better inference, and higher storage I/O.
Choosing the right networking equipment and design is crucial to create the best AI infrastructure. As a network administrator, you have a critical role in making it happen, by ensuring that the fabric works smoothly without disruptions and outages. Unfortunately, this is never the case, as no network is perfect.
You have likely found yourself in the middle of the storm at least one time in your career. Did you hear only blame when workloads were slow, storage was underperforming, or even worse, when the network was down and your AI systems were just lying there, doing nothing?
When network issues happen, the network telemetry dashboards are the first place that you check for anomalies, just like checking your car’s dashboard for warning lights when you hear strange noises from the engine. Sometimes, the issue is more sophisticated than the traditional telemetry methods can detect.
Even if you are a seasoned network engineer who can see problems from the ten-thousand-mile view, analyzing vast amounts of telemetry data can be time-consuming. Wasting time is not an available privilege in your company’s mission-critical AI tasks.
Accelerating time to root cause
When it comes to network troubleshooting, we can all agree that network telemetry is the key.
Some legacy methods, such as SNMP, sFLOW, or even network counters, provide lots of network information without necessarily identifying the root cause. It makes the life of network administrators even more challenging because finding an issue within all these huge amounts of data sometimes becomes so hard, just like finding the proverbial needle in a haystack.
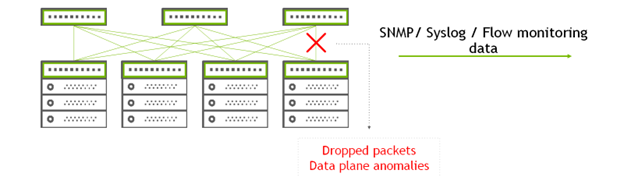
NVIDIA Spectrum Switches provide the What Just Happened (WJH) streaming telemetry. This unique application-specific integrated circuit (ASIC) telemetry feature provides switch-level, real-time, and contextual flow monitoring in line rate. WJH analyzes all packets passing through the switch and alerts on performance issues caused by packet drops, congestion, high latency, or even misconfigurations.
Because WJH is ASIC-level telemetry, it provides detailed information about the affected packets, including the packet header information. As a result, it enables you to quickly identify the root cause of data-plane anomalies, which is hard to do. With this data, you can also detect the affected traffic in the fabric, whether it’s the compute, storage, management, or other non-AI workload-related traffic.
How does it work?
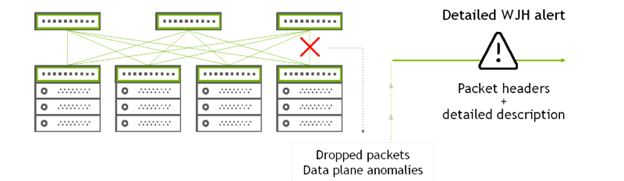
When the switch’s ASIC drops a packet, it generates a WJH event. In the event, you can find the packet’s header information (5/12 tuples) without including its payload. Streaming complete packets is insufficient in terms of performance, bandwidth, and space utilization while providing too little benefit.
In addition to packet tuples, WJH provides a detailed description of why, when, and where the packet was dropped and a corrective action recommendation. WJH also alerts when packet latency exceeds the set threshold or when a particular switch’s buffer usage percentage is crossed. It helps detect network bottlenecks, discover application slowness, and avoid future drops caused by an overflowed buffer.
What does WJH monitor?
WJH events are grouped into the following categories, each with its own set of drop reasons and notifications:
- Layer 1: Events such as flaky cable and CRC errors, auto-negotiation failures, optical signal degradation, and so on.
- Layer 2: Drops caused by VLAN misconfiguration, incorrect VLAN tag on the ingress port, suspicious or reserved MAC addresses, and so on.
- Layer 3 (Router): Router-related drops and issues like blackhole routes and routing loops detection (TTL expiration), too small MTU, and so on.
- Overlay (VXLAN): Encapsulation or decapsulation errors and down tunnel interface.
- Access control list (ACL): Every MAC/IP ACL drop with the exact rule that dropped packets. Although denying packets is a valid ACL operation, these events enable you to ensure that the ACL and its rules are correct and filter these notices if expected.
- Congestion: Buffer tail drops, WRED drops, and alerts on buffer utilization threshold crossing to avoid future drops.
- Latency: Packet latency beyond the set threshold. It helps discover the switch creating the application slowness.
For more information, see WJH Event Messages Reference.
How to consume WJH data?
There are several ways to consume WJH events:
- NVIDIA NetQ
- Standard gNMI streaming
- Cumulus Linux or SONiC network OS CLI
NVIDIA NetQ monitoring
NVIDIA NetQ is a highly scalable, modern network operations toolset that provides real-time visibility into your network. It uses network protocols and service validations and uses telemetry data, including the WJH, to deliver actionable insights about the health of your network infrastructure and data plane anomalies.
The NetQ agent installed on the switch aggregates the WJH events by their categories and types and streams them to the NetQ server, either on-premises or as SaaS, using the gRPC protocol. You can then access the WJH data using the NetQ interface and command-line interface (CLI).
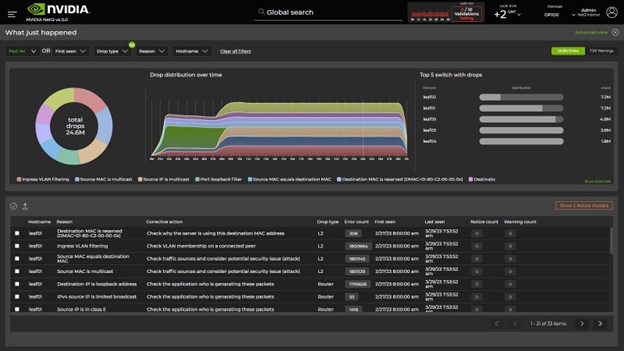
WJH dashboard
The dashboard interactively presents highly detailed WJH event information. You can easily examine event distribution through a pie chart and time-based graph. The dashboard also provides information on the top affected switches and drop type distribution.
The dashboard also includes a complete table listing all events by their reasons, detailed information, timestamps, and aggregated count. To view specific WJH data, you can filter the events by time, devices, drop types, and reasons and then export them into JSON or CSV files.
WJH Advanced View
The WJH advanced view presents all events listed in tables per category. You can review, sort, filter, or export the events to JSON or CSV files.

NetQ CLI
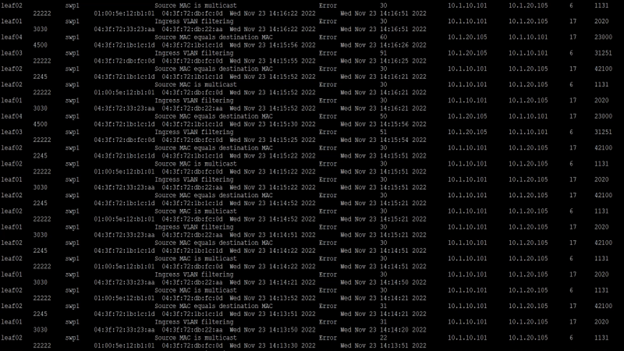
The NetQ CLI gives you access to all NetQ data, including WJH, from any device registered to the NetQ server and NetQ CLI installed. You can examine aggregated WJH events distribution and view all event details, reasons, and timestamps listed in a table.
For more information, see How to NetQ: Diagnose Network Problems Faster with NVIDIA What Just Happened.
NetQ also enables you to use WJH telemetry integrated into the Flow Analysis feature to identify and troubleshoot specific application issues caused by the network. For more information, see Finding Out Where Your Application and Network Intersect and How to NetQ: Troubleshooting Application Performance with Flow Analysis Using the GUI.
Standard gNMI streaming
The NetQ agent provides you with flexibility in how you use the WJH telemetry. Use its ability to stream WJH data using the gNMI protocol and subscribe to WJH events. That enables you to integrate this information into your own telemetry dashboards and solutions without the need for a NetQ server.
The NetQ agent’s gNMI streaming capabilities include the standard OpenConfig YANG data models of interfaces, system, LLDP protocol, and platform. It also includes the NVIDIA extended interface counters and NVIDIA WJH models.
gNMI version: 0.7.0
supported models:
  - nvidia-wjh, NVIDIA, 1.0.1
  - nvidia-if-ethernet-counters-ext, NVIDIA, 1.0.0
  - openconfig-interfaces, OpenConfig, 2.3.2
  - openconfig-if-ethernet, OpenConfig, 2.9.0
  - openconfig-if-ethernet-ext, OpenConfig, 0.1.1
  - openconfig-system, OpenConfig, 0.5.0
  - openconfig-lldp, OpenConfig, 0.2.1
  - openconfig-platform, OpenConfig, 0.13.0
supported encodings:
  - JSON
You can subscribe to the WJH events with any gNMI client by following the NVIDIA WJH YANG Model. The following code example shows the WJH YANG model with the event categories paths to which you can subscribe.
module nvidia-wjh {
    // Entrypoint /oc-if:interfaces/oc-if:interface
    //
    // xPath L1     --> interfaces/interface[name=*]/wjh/aggregate/l1
    // xPath L2     --> /interfaces/interface[name=*]/wjh/aggregate/l2/reasons/reason[id=*][severity=*]
    // xPath Router --> /interfaces/interface[name=*]/wjh/aggregate/router/reasons/reason[id=*][severity=*]
    // xPath Tunnel --> /interfaces/interface[name=*]/wjh/aggregate/tunnel/reasons/reason[id=*][severity=*]
    // xPath Buffer --> /interfaces/interface[name=*]/wjh/aggregate/buffer/reasons/reason[id=*][severity=*]
    // xPath ACL    --> /interfaces/interface[name=*]/wjh/aggregate/acl/reasons/reason[id=*][severity=*]
The WJH event information is streamed in JSON format:
{
  "source": "10.210.24.112:9339",
  "subscription-name": "default-1680103195",
  "timestamp": 1680144504046097303,
  "time": "2023-03-30T02:48:24.046097303Z",
  "prefix": "interfaces/interface[name=swp1]/wjh/aggregate/l2/reasons/reason[severity=error][id=204]",
  "target": "netq",
  "updates": [
    {
      "Path": "state/drop",
      "values": {
        "state/drop": "[{\"AggCount\":31,\"Dip\":\"10.1.10.102\",\"Dmac\":\"04:3f:72:db:22:a1\",\"Dport\":22222,\"DropType\":\"L2\",\"EgressPort\":\"\",\"EndTimestamp\":1680144503,\"FirstTimestamp\":1680144473,\"Hostname\":\"leaf01\",\"IngressLag\":\"268435457\",\"IngressPort\":\"swp1\",\"Proto\":6,\"Reason\":\"Ingress VLAN filtering\",\"ReasonId\":204,\"Severity\":\"Error\",\"Sip\":\"10.1.10.101\",\"Smac\":\"04:3f:72:33:23:aa\",\"Sport\":22556}]"
      }
    }
  ]
}
{
  "source": "10.210.24.112:9339",
  "subscription-name": "default-1680103195",
  "timestamp": 1680144534271648272,
  "time": "2023-03-30T02:48:54.271648272Z",
  "prefix": "interfaces/interface[name=swp1]/wjh/aggregate/l2/reasons/reason[severity=error][id=210]",
  "target": "netq",
  "updates": [
    {
      "Path": "state/drop",
      "values": {
        "state/drop": "[{\"AggCount\":30,\"Dip\":\"10.1.10.102\",\"Dmac\":\"aa:bb:cc:dd:ee:ff\",\"Dport\":22222,\"DropType\":\"L2\",\"EgressPort\":\"\",\"EndTimestamp\":1680144533,\"FirstTimestamp\":1680144504,\"Hostname\":\"leaf01\",\"IngressLag\":\"268435457\",\"IngressPort\":\"swp1\",\"Proto\":6,\"Reason\":\"Source MAC equals destination MAC\",\"ReasonId\":210,\"Severity\":\"Error\",\"Sip\":\"10.1.10.101\",\"Smac\":\"aa:bb:cc:dd:ee:ff\",\"Sport\":23333}]"
      }
    }
  ]
}
For more information, see How to NetQ: gNMI Streaming of NVIDIA What Just Happened Events For Third-Party Integration.
Switch CLI
WJH events are available on the Cumulus Linux or SONiC network OS (NOS). You don’t have to use the NetQ agent or NetQ server but you do use the switch CLI to get the WJH data.
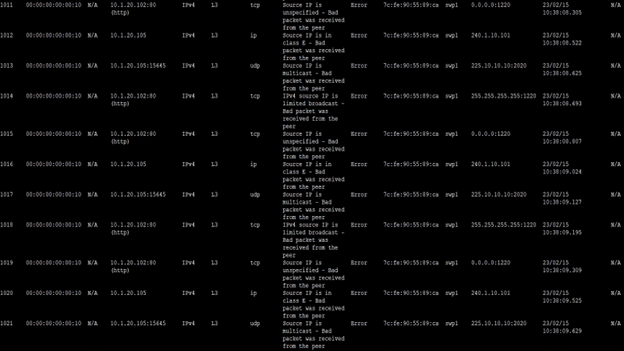
The events are available straight from the switch SDK, and you can view them listed in a detailed table, YAML, or JSON format. This method is significantly less convenient and provides limited debuggability. Consider using one of the other consumption options.
Conclusion
Powerful network infrastructure is as essential as a high-end GPU and storage systems in any AI deployment. It’s crucial to have superior telemetry methods to quickly identify the root causes of network issues when they happen.
NVIDIA What Just Happened brings a new aspect of network streaming telemetry by providing detailed and contextual information about packet drops and data plane anomalies. WJH reduces the troubleshooting time, and the time to root cause, enabling you to get the best out of your AI infrastructure.
For more information, see the following resources:
- NVIDIA NetQ User Guide
- WJH Event Messages Reference
- Videos:
- Posts:
