Modern organizations generate a massive volume of operational data through ticketing systems, incident reports, service requests, support escalations, and more. These tickets often hold critical signals about systemic issues, recurring pain points, and team performance. But extracting insights from them is a challenge.
Most ticketing platforms are built for workflow execution, not analysis. Structured fields are inconsistent, free-text descriptions are noisy, and cross-ticket relationships are rarely captured or queryable.
So when leadership asks…
- “What are the top recurring issues across our org?”
- “Which teams are repeatedly dealing with the same root causes?”
- “Why are certain groups resolving tickets faster or slower than others?”
- “Where are we seeing gaps in resolution quality or consistency?”
…you’re left cobbling together brittle queries, exports, or spreadsheets—if you even try at all.
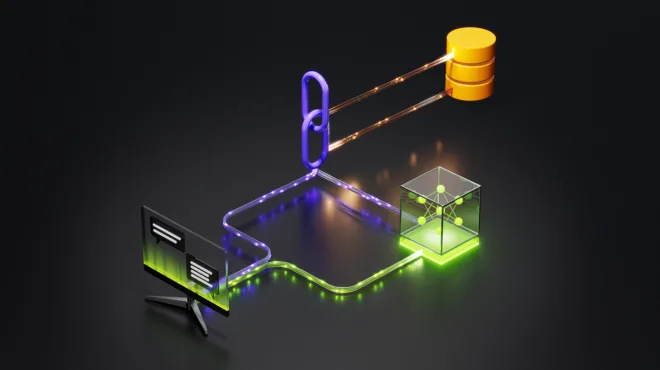
ITelligence, an internal AI agent built by NVIDIA’s IT organization, combines the advanced AI reasoning of NVIDIA Nemotron open models with the expressive power of graph databases. The purpose of the agent is twofold: 1) to uncover hidden insights within unstructured support ticket data by effectively leveraging LLMs to generate contextual insights. And 2), to use graph-based querying to track relationships, identify anomalies, and discover patterns at scale.
This blog post aims to share our learnings and provide a practical guide for others to build similar, powerful AI-driven intelligence agents in their own organizations.
While the described implementation focuses on IT operations, the proposed architecture and workflow are domain-agnostic and can be applied to any ticketing-based environment where unstructured records must be translated into structured insights—including security incident response, customer support platforms, or facilities management systems.
Building the foundation
The core of the system is a modular, scalable data pipeline that ingests, enriches, and analyzes operational data to power root causes and insight generation. The architecture is composed of the following key stages:
1. Data ingestion and graph modeling
Scheduled extract, transform, load (ETL) jobs can be used to extract data from multiple enterprise systems, including IT service management (ITSM) platforms (e.g., incident and request tickets), endpoint inventories, and identity sources. Instead of using a streaming platform or event-driven ingestion, we opt for a batch-based approach. This decision is driven by the fact that our use case can tolerate eventual consistency. Real-time ingestion was not necessary for our analysis, and periodic ETL jobs provide a simpler, more maintainable solution that aligns well with our operational needs.
Each data stream is normalized and loaded into a graph database, where entities are modeled as nodes (e.g., User, Incident, Device, Group, ServiceRequest) and their associations are modeled as relationships (e.g., OPENED_BY, ASSIGNED_TO, HAS_DEVICE, ASSIGNED_TO, REPORTS_TO).
This graph representation enables flexible, multi-hop querying that would be prohibitively expensive or complicated in traditional relational or flat reporting structures.
For instance, in the following figure, a simple graph query captures a complex operational pattern, revealing valuable insights across tickets, users, root causes, management chain, and assignment groups in a single analytical view.

2. Contextual enrichment jobs
To enhance each ticket with richer context, run enrichment jobs that join auxiliary attributes to users and devices at the time of the ticket. Examples include:
- Whether the ticket opener is a new hire (derived from the opener’s start date and the ticket’s open date)
- Device type (primary and secondary)
- Work mode (remote, hybrid, on-site)
- Employment type (contractor vs. full-time)
- user_created or bot_generated based on the source identifier or request origin
These enrichments can add semantic depth to the graph and allow downstream analytics to segment data by relevant dimensions without relying on user-filled fields.
3. Root cause analysis (RCA) jobs
Determining true root causes is often beyond the capabilities of standard ITSM classification. To solve this, we can invoke an LLM pipeline that processes each ticket individually. For every ticket, we can pass:
- The user’s reported issue (symptom)
- Closed notes from IT staff (actual resolution)
- Any enriched metadata
We can then prompt the LLM to extract a concise, comma-separated list of root cause keywords that represent the true nature of the issue (e.g., YubiKey, passkey, Microsoft Authenticator, registration) for each individual ticket. These generated RCAs can be stored as a new property on the ticket node, enabling precise grouping and analysis beyond traditional ITSM categories.
We tested different open source models available via NVIDIA NIM for this purpose, and the most accurate results were achieved with llama-3_3-70b-instruct
4. Insight generation jobs
Once tickets are enriched with structured RCAs, we can run scheduled insight-generation jobs that synthesize organization- or team-level patterns using LLMs. These jobs can be prompt-engineered for different insight types:
- MTTR insights: The system can select tickets with the highest resolution times and prompt the LLM to summarize why those cases took so long—highlighting delays, misroutes, dependencies, or gaps in standard operating procedures.
- Customer satisfaction insights: For tickets with a low customer satisfaction score (CSAT) or poor user feedback, we can generate executive-level summaries that highlight unmet expectations, recurring complaints, and potential areas for improvement—grouped by team or org.
- RCA insights: Selects tickets with the most frequent root causes (based on AI-generated RCAs). The LLM can be prompted to extract common symptoms, recurring resolution steps, and high-level patterns across these tickets—enabling teams to identify underlying systemic issues.
- New hire insights: Analyze tickets opened by new hires to surface onboarding pain points and early struggles, providing clear, actionable feedback to leaders on gaps and areas for improvement.
These insights can be tied back to the graph context (e.g., team, manager) to provide targeted, actionable intelligence per leader, group, or service owner.
5. Distributed alerting and automated insights delivery
To operationalize insights, we can build a distributed alerting system that continuously evaluates KPI trends across the graph. Predefined rules can trigger notifications when metrics drift beyond expected thresholds—for example, a spike in mean-time-to-resolve (MTTR) repeated RCAs, or a drop in CSAT. These alerts can be sent directly to relevant leaders or managers with context, affected tickets, and suggested focus areas.
This framework can also be used to deliver automated, AI-generated newsletters on a regular cadence. Each newsletter can be tailored per org or manager and can include:
- Top RCAs and recurring patterns
- High-impact tickets affecting key performance indicators (KPIs) like MTTR
- Summarized user feedback from low CSAT cases
- Week-over-week KPI trends
All insights are LLM-generated using structured prompts and enriched ticket data, ensuring every stakeholder receives targeted, context-aware summaries automatically.
This layered architecture, rooted in clean graph modeling and precise prompt engineering, allows the system to scale insight generation while staying adaptable to new data sources, org structures, and use cases.

Designing an intuitive AI-powered interface
With a rich, highly connected dataset powering the system—and spanning tickets, users, root causes, org hierarchies, devices, and more—data retrieval needs to be both powerful and accessible. Users shouldn’t need to understand the underlying graph schema, write Cypher queries, or rely on custom scripts to explore operational insights.
We need an interface that:
- Allows users to slice and filter data by meaningful dimensions
- Supports both structured queries and on-demand summarization
- Is intuitive enough for analysts and managers without deep technical expertise
- Reduces ambiguity and promotes accuracy in interpreting user intent
This leads us to evaluate two interface paradigms: conversational chatbots (using retrieval-augmented generation (RAG) + LLM) and interactive dashboards.
Given the complexity of the data model and the need for precision in interpreting user intent, we intentionally choose the latter—interactive dashboards—as the foundation of the platform interface. It offers a clear, reliable, and user-friendly way to navigate and extract insights from a highly structured graph.
Why not a RAG-based chatbot?
Given the recent momentum around RAG and conversational AI, it’s natural to ask: Why not just build a chatbot interface over the graph?
While the idea is appealing, we believe it falls short in practice, especially when working with a rich and highly relational schema.
In this case, the underlying database contains many interconnected entities and properties: tickets, users, devices, hierarchy, root causes, teams, services, assignment groups, etc. Translating open-ended natural language queries into precise, executable graph queries is not just non-trivial, it’s error-prone and often ambiguous.
The goal is to improve user productivity, not burden users with back-and-forth interactions just to clarify their intent in a chatbot interface. When users need answers, they should get them quickly and accurately, without guessing how to phrase a question to make the system understand.
For example, when a user asks:
“What are the most common issues related to VPNs recently?”
That question can map to multiple intents:
- Filter tickets where the root cause is VPN
- Filter tickets where the assignment group related to VPN
- Filter tickets that mention VPN in the description or metadata
- Interpret “recently” as the last seven days, 30 days, or a default time window, depending on user expectation
The model must resolve this ambiguity without guessing, which is extremely difficult with complex schemas and overlapping concepts. Generating accurate Cypher (or any query language) on the first attempt is unreliable, and debugging incorrect queries via chat is frustrating for end users who lack context about the underlying graph schema.
Recommended approach: AI-powered dashboard with on-demand summarization
To make insights both accessible and interactive, we recommend integration with interactive data-visualization platforms (we chose Grafana) powered by the graph database and a custom summary API service. All static data such as metrics, KPIs, pre-generated insights, tickets and their metadata, can be pulled directly from the graph in real time.
However, one area of manual toil remains: Even after filtering tickets by criteria such as RCA = driver, audio and Assignment Group = X, Y, users have to manually review individual tickets to uncover common pain points and resolution patterns. This makes analysis slow and difficult to prioritize systemic improvements.
To automate this workflow, we can introduce a summary service API that connects directly to the Grafana dashboard. When a user selects filters, such as org, assignment group, root cause, or category, those variables can be sent to the summary service API as a JSON payload via an Infinity data source tied to a Business Text panel.
On the backend, the summary service can:
- Receive the selected criteria (i.e., user selected variables from the dashboard)
- Retrieve matching tickets from the graph
- Inject them into a structured prompt
- Send the prompt to the NVIDIA NIM API (Check out build.nvidia.com to get started) for LLM-based summarization
- Return the response to the data visualization platform for display
The output can then be rendered in the AI-generated summary panel, delivering a concise executive summary that includes:
- Common issues and symptoms
- Typical resolution paths
- Recurring failure patterns (location, employment type, device, etc.)
- AI-generated recommendations
This removes the need for manual ticket triage and gives teams on-demand, contextual understanding, right from the dashboard.

Learn more
This AI agent is designed to bridge a critical gap in IT ticketing operations: the challenge of deriving meaningful insights from large volumes of unstructured ticket data. By integrating AI-powered analysis, graph-based modeling, and flexible querying, the platform turns operational noise into clear, actionable intelligence.
From automated root cause identification and rich contextual enrichment to real-time executive summaries and proactive alerting, the agent can equip teams with the clarity and speed needed to make informed decisions.
Stay up to date on NVIDIA Nemotron by subscribing to NVIDIA news and following NVIDIA AI on LinkedIn, X, Discord, and YouTube.
- Visit our Nemotron developer page for all the essentials you need to get started with the most open, smartest-per-compute reasoning model.
- Explore new open Nemotron models and datasets on Hugging Face and NIM microservices and Blueprints on build.nvidia.com.
- Share your ideas and vote on features to help shape the future of Nemotron.
- Tune into upcoming Nemotron livestreams and connect with the NVIDIA Developer community through the Nemotron developer forum and the Nemotron channel on Discord
Browse video tutorials and livestreams to get the most out of NVIDIA Nemotron


