
In part 1, I introduced the code for profiling, covered the basic ideas of analysis-driven optimization (ADO), and got you started with the NVIDIA Nsight Compute profiler. In part 2, you began the iterative optimization process. In this post, you finish the analysis and optimization process, determine whether you have reached a reasonable stopping point, and I draw some final conclusions.
Converting the reduction to warp-shuffle
The result of the analysis from part 2 is that your focus has been placed on the following line of code, with the idea of reducing shared memory pressure:
if (id < s) smem[id] += smem[id+s];}
What can you do? In the code refactoring of the previous step, you converted to a warp-stride loop, to permit coalesced access. That resulted in the averaging sum operation spreading across all 32 members of the warp. Thus, you had to combine these, before computing the average. You used a warp-shuffle reduction there, for convenience and simplicity.
The line of code you are focused on now is also part of a reduction, but it is using a classical shared-memory sweep parallel reduction methodology. You can reduce the pressure on shared memory here, by converting the reduction to use a similar warp-shuffle based reduction methodology. Because this involves multiple warps in this second phase of your kernel activity, the code is a two-stage warp-shuffle reduction. For more information about warp-shuffle, see Faster Parallel Reductions on Kepler.
The refactored kernel looks like the following code example:
template
__global__ void gpu_version4(const T * __restrict__ input, T * __restrict__ output, const T * __restrict__ matrix, const int L, const int M, const int N){
  // parallelize threadIdx.x over vector length, and blockIdx.x across k (N)
  // do initial vector reduction via warp-stride loop
  __shared__ T smem[my_L];
  int idx = threadIdx.x;
  int idy = threadIdx.y;
  int id  = idy*warpSize+idx;
  int k = blockIdx.x;
  T v1;
  for (int y = threadIdx.y; y < L; y+=blockDim.y){ // vertical block-stride loop
    v1 = 0;
    for (int x = threadIdx.x; x < M; x+=warpSize)  // horizontal warp-stride loop
      v1 += input[k*M*L+y*M+x];
    for (int offset = warpSize>>1; offset > 0; offset >>= 1) // warp-shuffle reduction
       v1 += __shfl_down_sync(0xFFFFFFFF, v1, offset);
    if (!threadIdx.x) smem[y] = v1/M;}
  __syncthreads();
  v1 = smem[id];
  for (int i = 0; i < L; i++){                     // matrix-vector multiply
    T v2 = v1 * matrix[i*L+id];
    // 1st warp-shuffle reduction
    for (int offset = warpSize>>1; offset > 0; offset >>= 1)
       v2 += __shfl_down_sync(0xFFFFFFFF, v2, offset);
    if (idx == 0) smem[idy] = v2;
   __syncthreads(); // put warp results in shared mem
    // hereafter, just warp 0
    if (idy == 0){
       // reload v2 from shared mem if warp existed
       v2 = (idx < ((blockDim.x*blockDim.y)>>5))?smem[idx]:0;
       // final warp-shuffle reduction
       for (int offset = warpSize>>1; offset > 0; offset >>= 1)
          v2 += __shfl_down_sync(0xFFFFFFFF, v2, offset);}
    if (!id) output[k+i*N] = v2;}
}
You have replaced your shared-memory sweep reduction with a two-stage warp-shuffle reduction. No changes are needed at the kernel launch point, other than to change the name of the kernel to your new gpu_version4. If you compile and run this code, you see an additional speedup:
CPU execution time: 0.5206s
Kernel execution time: 0.012659s
|
|
baseline |
Step 1 |
Step 2 |
Step 3 |
|
Kernel duration |
2.92s |
0.0789s |
0.0216s |
0.0127s |
Return to the profiler. Repeat the disconnect, connect, launch, run sequence and then reset the baseline. Figure 1 shows the results.
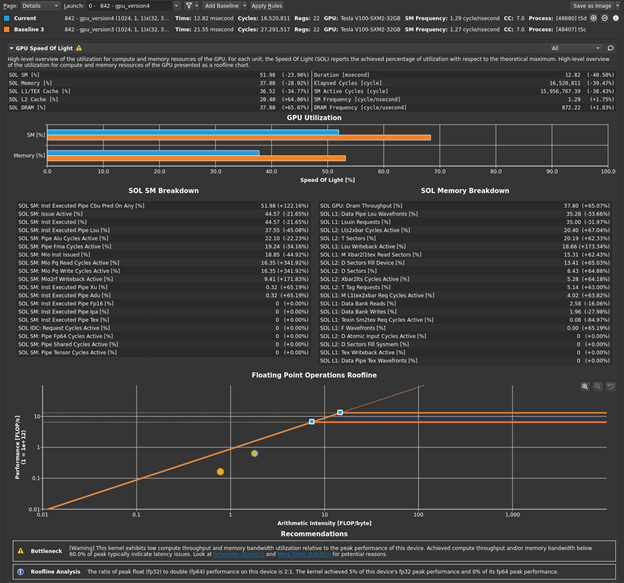
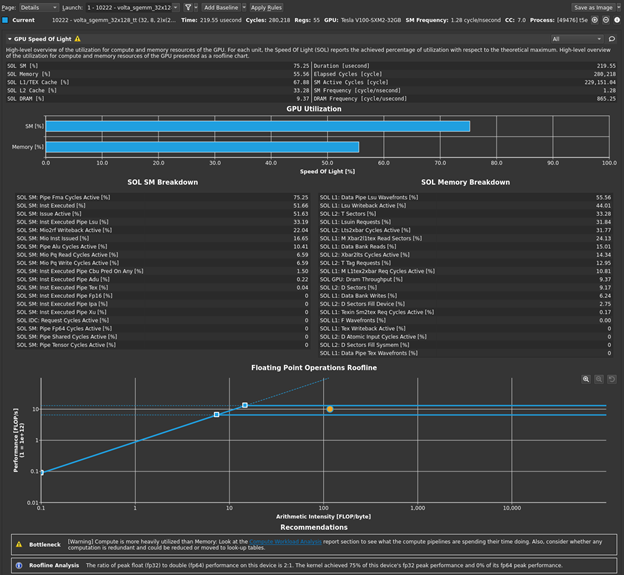
The bottleneck rule has pointed you back to latency again, with the same message as in the previous post, because this latest change relieved pressure on most of the various GPU subsystems. The latency that the profiler is now pointing out is just the memory latency inherent in your loading of ~4 GB of data for this processing. You can get a sense of this by looking at the Warp State Statistics section, where you now see Stall Long Scoreboard as your most significant stall reason (Figure 2).
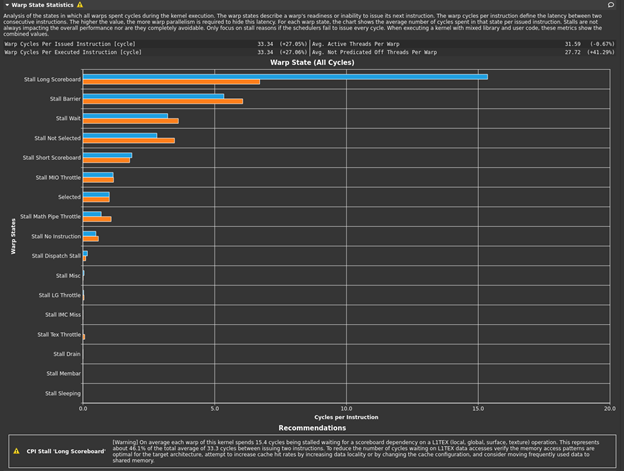
Hover over Stall Long Scoreboard for the description: “Average number of warps resident per issue cycle, waiting on a scoreboard dependency on L1TEX (local, global, surface, tex) operation”. For more information, see Warp Scheduler States. Likewise, the rule states:
[Warning] On average each warp of this kernel spends 15.4 cycles being stalled waiting for a scoreboard dependency on a L1TEX (local, global, surface, texture) operation. This represents about 46.1% of the total average of 33.3 cycles between issuing two instructions. To reduce the number of cycles waiting on L1TEX data accesses verify the memory access patterns are optimal for the target architecture, attempt to increase cache hit rates by increasing data locality or by changing the cache configuration, and consider moving frequently used data to shared memory.
You already know you don’t have local, surface, or (explicit) tex operations, so global memory is again the focus. You can again get an additional sense of this by looking at the source view (Figure 3).
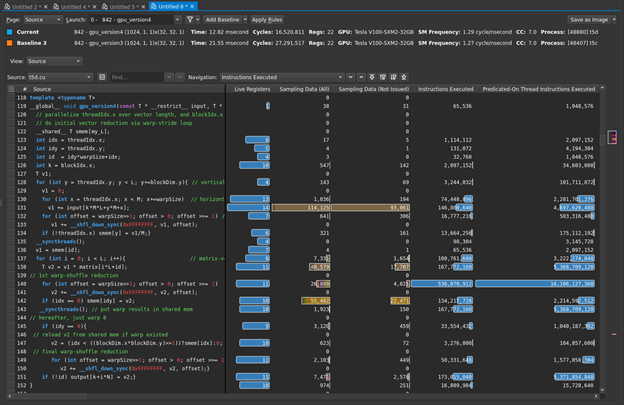
The following line of code is dominating the sampling data, as well as being the biggest contributor to your warp stall reasons:
v1 += input[k*M*L+y*M+x];
Hover the mouse over the brown bars to get the warp stall reasons. It is easy to see in Figure 3, but what if it were less obvious or you had more code to sort through? The profiler can help you here. On the Details page, the Warp State Statistics section listed the highest stall reason as Stall Long Scoreboard. How can you find the line with the highest contributor to that? First, for Navigation, select stall_long_sb. Then, choose the button to the right with an up-arrow and a line. This asks the profiler to show the line with the highest reported value for that metric (Figure 4). The profiler highlighted the expected line for you.

You have optimized this step as much as possible. How can you be sure of that? At this point, to achieve your next (and final) round of optimization and to answer this important question, you must revisit your code and consider more major refactoring.
At a high level, your code is producing a set of intermediate vectors that are the results of the averaging phase and then multiplying each of those vectors by an unchanging matrix to get a set of result vectors. This second phase of operations, the matrix-vector multiply step, could be refactored to be a matrix-matrix multiply because the input matrix is constant across each matrix-vector multiply step.
You could rewrite or decompose your kernel into two separate kernels. The first kernel performs the vector averaging, writing out the set of average vectors as a matrix. The second kernel performs the matrix-matrix multiply. Rather than writing your own kernel for this second phase refactored, use cuBLAS, a highly optimized library. This refactoring also means that you must store the intermediate vector results in global memory to facilitate passing them to the cuBLAS gemm (matrix-matrix multiply) operation, along with the input matrix. This store to global was not necessary in your previous realizations, because you could just carry the vector forward in local thread storage, for use in the matrix-vector multiply.
This refactoring also isolates the vector averaging step, which allows you to get an independent measurement of whether this step is truly optimal. The first phase vector averaging, now isolated in its own kernel, is dominated by the global load operations of 4 GB of data, focused on the line of code the profiler has already indicated in this step.
Refactoring redux
As indicated in the previous section, your task now is to refactor your code by breaking the kernel into two pieces, the first of which is your existing phase 1 kernel code but writing out the intermediate vector into a matrix of results, in global memory. The second piece is a properly crafted cuBLAS SGEMM call, to perform the matrix-matrix multiply operation. Getting this right involves accounting for the transpositions needed on the input data and when comparing the results for accuracy. The final refactored code looks like the following code example:
// compile with: nvcc -Xcompiler -fopenmp -o t5 t5.cu -O3 -lineinfo -lcublas
#include
#include
#include

#define cudaCheckErrors(msg) \
  do { \
    cudaError_t __err = cudaGetLastError(); \
    if (__err != cudaSuccess) { \
        fprintf(stderr, "Fatal error: %s (%s at %s:%d)\n", \
            msg, cudaGetErrorString(__err), \
            __FILE__, __LINE__); \
        fprintf(stderr, "*** FAILED - ABORTING\n"); \
        exit(1); \
    } \
  } while (0)

// cuBLAS API errors
static const char *_cudaGetErrorEnum(cublasStatus_t error)
{
    switch (error)
    {
        case CUBLAS_STATUS_SUCCESS:
            return "CUBLAS_STATUS_SUCCESS";

        case CUBLAS_STATUS_NOT_INITIALIZED:
            return "CUBLAS_STATUS_NOT_INITIALIZED";

        case CUBLAS_STATUS_ALLOC_FAILED:
            return "CUBLAS_STATUS_ALLOC_FAILED";

        case CUBLAS_STATUS_INVALID_VALUE:
            return "CUBLAS_STATUS_INVALID_VALUE";

        case CUBLAS_STATUS_ARCH_MISMATCH:
            return "CUBLAS_STATUS_ARCH_MISMATCH";

        case CUBLAS_STATUS_MAPPING_ERROR:
            return "CUBLAS_STATUS_MAPPING_ERROR";

        case CUBLAS_STATUS_EXECUTION_FAILED:
            return "CUBLAS_STATUS_EXECUTION_FAILED";

        case CUBLAS_STATUS_INTERNAL_ERROR:
            return "CUBLAS_STATUS_INTERNAL_ERROR";
    }

    return "";
}

#include
#include <sys/time.h>
#define USECPSEC 1000000ULL

unsigned long long dtime_usec(unsigned long long start){

  timeval tv;
  gettimeofday(&tv, 0);
  return ((tv.tv_sec*USECPSEC)+tv.tv_usec)-start;
}

// perform vector averaging over M vectors of length L,  followed by matrix-vector multiply
// repeat the above N times
// input vectors are stored as a set of N column-major matrices
// for each k in N: output[k] = matrix*input[k]
template
void cpu_version1(T *input, T *output, T *matrix, int L, int M, int N){
#pragma omp parallel for
  for (int k = 0; k < N; k++){      // repeat the following, N times
    std::vector v1(L);           // vector length of L
    for (int i = 0; i < M; i++)     // compute average vector over M input vectors
      for (int j = 0; j < L; j++)
        v1[j] += input[k*M*L+j*M+i];
    for (int j = 0; j < L; j++)
      v1[j] /= M;
    for (int i = 0; i < L; i++)     // matrix-vector multiply
      for (int j = 0; j < L; j++)
        output[i*N+k] += matrix[i*L+j]*v1[j];
  }
}

const int my_L = 1024; // maximum 1024
const int my_M = 1024;
const int my_N = 1024;


template
__global__ void gpu_version5(const T * __restrict__ input, T * __restrict__ output, const int L, const int M, const int N){
  // parallelize threadIdx.x over vector length, and blockIdx.x across k (N)
  // do initial vector reduction via warp-stride loop
  int k = blockIdx.x;
  T v1;
  for (int y = threadIdx.y; y < L; y+=blockDim.y){ // vertical block-stride loop
    v1 = 0;
    for (int x = threadIdx.x; x < M; x+=warpSize)  // horizontal warp-stide loop
      v1 += input[k*M*L+y*M+x];
    for (int offset = warpSize>>1; offset > 0; offset >>= 1) // warp-shuffle reduction
       v1 += __shfl_down_sync(0xFFFFFFFF, v1, offset);
    if (!threadIdx.x) output[k+y*N] = v1/M;}
}


typedef float ft;

int main(){
  ft *d_input, *h_input, *d_output, *h_outputc, *h_outputg, *d_matrix, *h_matrix, *d_result;
  int L = my_L; int M = my_M; int N = my_N;
  // host allocations
  h_input   = new ft[N*L*M];
  h_matrix  = new ft[L*L];
  h_outputg = new ft[N*L];
  h_outputc = new ft[N*L];
  // data initialization
  for (int i = 0; i < N*L*M; i++) h_input[i] = (rand()&1)+1;  // 1 or 2
  for (int i = 0; i < L*L; i++) h_matrix[i]  = (rand()&1)+1;  // 1 or 2
  // create result to test for correctness
  unsigned long long dt = dtime_usec(0);
  cpu_version1(h_input, h_outputc, h_matrix, L, M, N);
  dt = dtime_usec(dt);
  std::cout << "CPU execution time: " << dt/(float)USECPSEC << "s" << std::endl;
  // device allocations
  cudaMalloc(&d_input, N*L*M*sizeof(ft));
  cudaMalloc(&d_output,  N*L*sizeof(ft));
  cudaMalloc(&d_matrix,  L*L*sizeof(ft));
  cudaMalloc(&d_result,  N*L*sizeof(ft));
  cudaCheckErrors("cudaMalloc failure");
  // copy input data from host to device
  cudaMemcpy(d_input,  h_input,  N*L*M*sizeof(ft), cudaMemcpyHostToDevice);
  cudaMemcpy(d_matrix, h_matrix,   L*L*sizeof(ft), cudaMemcpyHostToDevice);
  cudaMemset(d_output, 0, N*L*sizeof(ft));
  cudaCheckErrors("cudaMemcpy/Memset failure");
  // cublas setup
  cublasHandle_t h;
  ft alpha = 1.0;
  ft beta  = 0.0;
  cublasStatus_t c_res = cublasCreate(&h);
  if (c_res != CUBLAS_STATUS_SUCCESS) {std::cout << "CUBLAS create error: " << _cudaGetErrorEnum(c_res) << std::endl; return 0;}
  // run on device and measure execution time
  dim3 block(32,32);
  dt = dtime_usec(0);
  gpu_version5<<<N, block>>>(d_input, d_output, L, M, N);
  cudaCheckErrors("kernel launch failure");
  c_res = cublasSgemm(h, CUBLAS_OP_T, CUBLAS_OP_T,
                           N, N, L, &alpha,
                           d_matrix, L,
                           d_output, N, &beta,
                           d_result, N);
  if (c_res != CUBLAS_STATUS_SUCCESS) {std::cout << "CUBLAS gemm error: " << _cudaGetErrorEnum(c_res) << std::endl; return 0;}
  cudaDeviceSynchronize();
  cudaCheckErrors("execution failure");
  dt = dtime_usec(dt);
  cudaMemcpy(h_outputg, d_result, N*L*sizeof(ft), cudaMemcpyDeviceToHost);
  cudaCheckErrors("cudaMemcpy failure");
  for (int i = 0; i < N; i++)
    for (int j = 0; j < L; j++) if (h_outputg[i+N*j] != h_outputc[j+N*i]) {std::cout << "Mismatch at " << i << " was: " << h_outputg[i] << " should be: " << h_outputc[i] << std::endl; return 0;}
  std::cout << "Kernel execution time: " << dt/(float)USECPSEC << "s" << std::endl;
  return 0;
}
If you compile and run this code, you get results like the following example:
$ nvcc -o t5 t5.cu -Xcompiler -fopenmp -O3 -lineinfo -lcublas
$ ./t5
CPU execution time: 0.521357s
Kernel execution time: 0.005525s
$
|
|
baseline |
Step 1 |
Step 2 |
Step 3 |
Step 4 |
|
Kernel duration: |
2.92s |
0.0789s |
0.0216s |
0.0127s |
0.00553s |
You have again improved the performance of your code and your GPU implementation is now almost 100x faster than your CPU OpenMP version. To be fair, this final optimization to convert the sequence of matrix-vector multiply operations into a single matrix-matrix multiply could equivalently be done on the CPU version. Using a high-quality CPU BLAS library would also probably give a better result there.
What about the question asked earlier, “Is your global load operation optimal?” Because the first kernel is now dominated by the global loading of 4 GB of data, you can estimate the achieved bandwidth and compare it to a proxy measurement of the achievable memory bandwidth on your GPU. If the two numbers are close to each other, you can conclude that the global loading operation is nearly optimal and could not get any better. For the proxy measurement of achievable memory bandwidth on your GPU, use the CUDA sample code bandwidthTest. When run on this V100 GPU, the output looks like the following code example:
$ /usr/local/cuda/samples/bin/x86_64/linux/release/bandwidthTest
[CUDA Bandwidth Test] - Starting...
Running on...

 Device 0: Tesla V100-SXM2-32GB
 Quick Mode

 Host to Device Bandwidth, 1 Device(s)
 PINNED Memory Transfers
   Transfer Size (Bytes)        Bandwidth(GB/s)
   32000000                     12.4

 Device to Host Bandwidth, 1 Device(s)
 PINNED Memory Transfers
   Transfer Size (Bytes)        Bandwidth(GB/s)
   32000000                     13.2

 Device to Device Bandwidth, 1 Device(s)
 PINNED Memory Transfers
   Transfer Size (Bytes)        Bandwidth(GB/s)
   32000000                     739.2
The last number is the one you are interested in. A V100 has about 740 GB/s of available memory bandwidth, according to this measurement. The GB used here is 1 billion bytes, not 2^30 bytes. To get a comparison for your kernel, you must get a timing duration for just the kernel, not the kernel plus cuBLAS call.
Of course, you could modify the timing in your code to print this out but look at the profiler one last time. There are now two kernels in your code: one that you wrote, and one that is launched by the cuBLAS call. Not all cuBLAS calls result in one single kernel call, but this usage does. Now when you disconnect, connect, launch, and choose Run to next kernel, you profile just your version 5 kernel. The profiler reports the execution duration as 5.22 milliseconds (Figure 5).
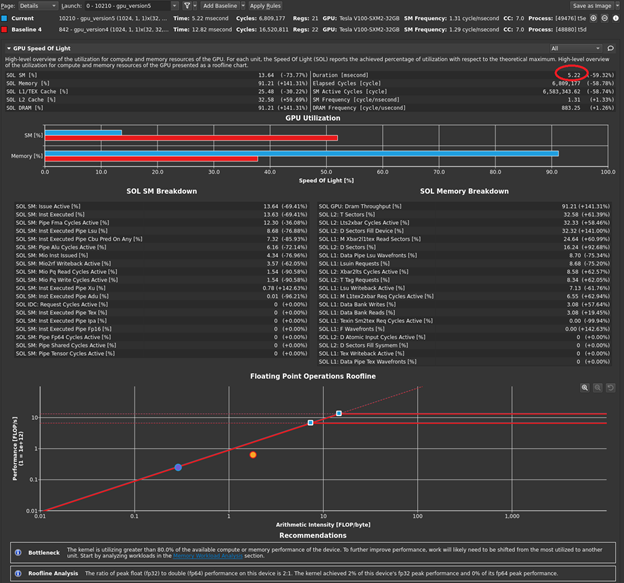
This is most of the overall execution time that you measured of ~5.5 milliseconds! The 4 GB of data that you have is 4x1024x1024x1024 bytes. If you divide that by 5.22 milliseconds, you get an achieved bandwidth of approximately 823 GB/s, using the GB that is used by bandwidthTest. So, your averaging kernel is performing even better than bandwidthTest and is approximately optimal. The profiler output also indicates greater than 90% memory utilization, agreeing with your measurement. Choose Run to next kernel one more time, because you still have the cuBLAS SGEMM kernel waiting in the wings. Figure 6 shows the results in the GPU Speed of Light section after the baseline is cleared.
As you suspected, this kernel (volta_sgemm_32x128_tt) is short, around 220 microseconds, making up most of the difference between your 5.2 millisecond global load kernel time and the overall measured duration of ~5.5 milliseconds. The profiler also reports this highly optimized library kernel is running the GPU at a high level of both compute utilization and memory utilization. You have some solid data now that says your code is roughly optimal, and now you should spend your precious time elsewhere.
Suggestions
The Nsight Compute profiler provides a large amount of information. In this post, I’ve only scratched the surface of the data presented and the tool’s capabilities. No post like this could hope to give a complete treatment. The amount of information here may require some effort to process. The following are some observations and suggestions to help you:
- Shorter is better. If you have a large kernel to analyze, the analysis is usually going to be more difficult. Some of the conclusions that you reached in this post were aided by the fact that you had only 10-20 lines of source code in your kernel to study.
- Kernels that change behavior are more difficult to perform high-level analysis on. The kernel in this example changed behavior from the first phase (vector averaging) to the second phase (matrix-vector multiply). In these cases, it may be expedient to break the kernel up into pieces that correspond to the behavioral phases of activity.
Summary
This post focused on an ADO process using Nsight Compute and a single kernel. If you have a complex application with multiple kernels, the ADO process usually starts with Nsight Systems, and you may iterate back and forth between Nsight Systems and Nsight Compute, as you optimize kernels and other kernels move to the top of the priority list.
The analysis work in this post was performed on a machine with the following characteristics: Ubuntu 18.04.3, CUDA 11.1, GPU Driver version 455.23.05, GCC version 7.5.0, V100-SXM2-32 GB GPU, Intel® Xeon® Gold 6130 CPU @ 2.10GHz. The code examples presented in this post are for instructional purposes only. They are not guaranteed to be defect-free or suitable for any particular purpose.
For more information, see the following resources:
- Hands-on optimization tutorial for NVIDIA Nsight tools
- GPU Performance Analysis video (part 8 of a 9-part CUDA Training Series that NVIDIA presented for OLCF and NERSC)
- Accelerating HPC Applications with NVIDIA Nsight Compute Roofline Analysis.
- Roofline and NVIDIA Ampere GPU Architecture Analysis video
Acknowledgements
The author would like to thank the following individuals for their contributions: Sagar Agrawal, Rajan Arora, Ronny Brendel, Max Katz, Felix Schmitt, Greg Smith, and Magnus Strengert.
