
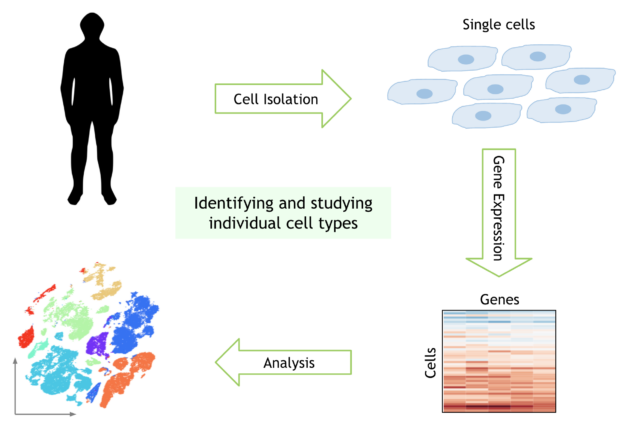
The human body is made up of nearly 40 trillion cells, of many different types. Recent advances in experimental biology have made it possible to explore the genetic material of single cells. With the birth of this new field of single-cell genomics, scientists can now probe the DNA and RNA of individual cells in the human body.
Single-cell genomic analysis has identified new types of cells in the human body, discovered what makes these cells different from each other, and how different types of cells respond to disease or drugs. Single-cell genomics has also proven key in the current COVID-19 pandemic, identifying cells susceptible to infection and revealing changes in the immune systems of infected patients.
The availability of single-cell data is continuously increasing, as are dataset sizes, with recent experiments sequencing millions of cells. This analysis is often exploratory and further benefits from being interactive – to identify different types of cells at finer scales, to compare the cell types and to visualize the relationships between them. Current workflows are still very slow, making them prohibitive for the interactive analysis needed for research.
RAPIDS: Accelerating data science with GPUs
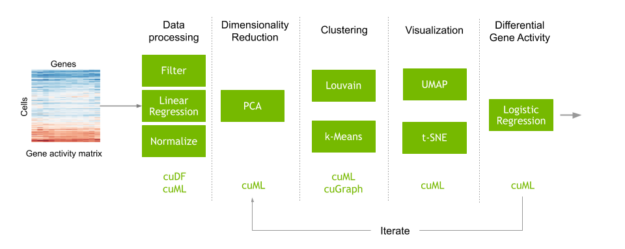
RAPIDS is a suite of open-source libraries that can speed up end-to-end data science workflows through the power of GPU acceleration. RAPIDS makes it possible to perform interactive data analysis on large datasets using Python APIs that closely resemble NumPy, Pandas, and scikit-learn.
Consider a typical workflow to perform single cell analysis. This begins with a matrix that maps the counts of each gene encountered in each cell. Preprocessing steps are performed to filter out noise, then the data is normalized to obtain the activity of every human gene in every individual cell of the dataset. Machine learning is also commonly used in this step to correct artifacts from data collection. Next, you perform dimensionality reduction before clustering and visualization to identify clusters of cells with similar genetic activity. Finally, you compare the genetic activity of these cell clusters to understand why different types of cells behave and respond differently.
We released a GPU-accelerated version of this exact workflow in the clara-parabricks/rapids-single-cell-examples GitHub repo. The repo contains an example notebook that uses RAPIDS and Scanpy to analyze a dataset of 70,000 human lung cells, to identify cells that are susceptible to COVID-19. Scanpy is a toolkit for analyzing single-cell gene expression data, with options to accelerate specific commands using RAPIDS. We also have a CPU version of this notebook in the repo for comparison.
For example, running UMAP to visualize almost 70,000 cells with RAPIDS requires the following command:
sc.tl.umap(adata, min_dist=umap_min_dist, spread=umap_spread, method='rapids')
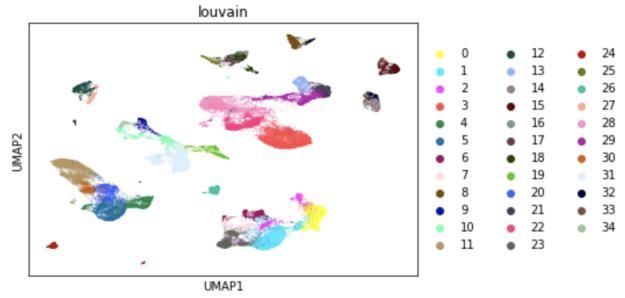
Generating this UMAP visualization takes one second using RAPIDS, compared to 80 seconds on a CPU. In fact, RAPIDS can accelerate the entire single-cell analysis workflow, making it possible to do interactive exploratory data analysis even on large datasets.
| Instance | m5a.12xlarge | p3.2xlarge | Acceleration Factor |
| CPU/GPU type | Intel Xeon Platinum 8000, 48 vCPUs | V100-16GB | |
| Preprocessing | 311 | 84 | 4 |
| PCA | 18 | 3.4 | 5 |
| t-SNE | 208 | 2.2 | 95 |
| k-Means clustering | 31 | 0.4 | 78 |
| KNN | 25 | 6.1 | 4 |
| UMAP | 80 | 1 | 80 |
| Louvain clustering | 17 | 0.3 | 57 |
| Differential Gene Expression | 54 | 10.8 | 5 |
| End-to-end | 787 (13 Min) | 134 (2 Min) | 6 |
| Instance Price/hr ($) | 2.064 | 3.06 | |
| Total Run Cost ($) | 0.451 | 0.114 | 4 |
Analyzing one million cells in 11 minutes
We applied our RAPIDS analysis workflow next to one of the largest single-cell datasets available, one million mouse brain cells sequenced by 10X Genomics. For more information, see the 1M_brain_gpu_analysis_uvm.ipynb Jupyter notebook.
With this scale of data, analysis on CPUs becomes impractically slow; our end-to-end workflow took over three hours to run on an AWS M5a CPU instance. This makes interactive analysis virtually impossible. On the other hand, we observed even higher GPU acceleration on this larger dataset and were able to analyze the entire dataset in just over 11 minutes on a single GPU. Running the RAPIDS analysis on AWS was also 3x cheaper than the CPU version!
| AWS Instance | m5a.12xlarge | p3.8xlarge | Acceleration Factor |
| CPU/GPU type | Intel Xeon Platinum 8000, 48 vCPUs | V100-16GB | |
| Preprocessing | 4033 | 323 | 12.5 |
| PCA | 34 | 20.6 | 1.7 |
| t-SNE | 5417 | 41 | 132.1 |
| k-Means clustering | 106 | 2.1 | 50.5 |
| KNN | 585 | 53.4 | 11.0 |
| UMAP | 1751 | 20.3 | 86.3 |
| Louvain clustering | 597 | 2.5 | 238.8 |
| End-to-end | 13002 | 672.7 | 19.3 |
| Instance Price/hr ($) | 2.064 | 12.24 | |
| Total Run Cost ($) | 7.455 | 2.287 | 3.3 |
A GPU-powered cell browser for interactive single-cell analysis
As I mentioned earlier, the speed of data analysis with RAPIDS enables researchers to analyze data interactively in real time. We made this process even easier by developing a GPU-powered interactive cell browser that runs within a Jupyter notebook. Within this cell browser, you can visualize all the cells in a dataset and perform clustering analysis of your data through point and click methods. Using RAPIDS, these steps run in real time.
In this post, I show how you can easily select a group of cells and perform UMAP and Louvain clustering to identify subpopulations within this cell type.
Conclusion
In this post, you saw how easy it is to use RAPIDS to accelerate single-cell genomic analysis on GPUs. With RAPIDS, it becomes easy to explore the data interactively in real time, cluster cells at different scales, and re-analyze large datasets with different parameters. All of this enables faster scientific discoveries.
In addition to the APIs covered, RAPIDS has a large library of other algorithms that you might find useful in your work. For more information, see the clara-parabricks/rapids-single-cell-examples GitHub repo for this work as well as RAPIDS.
