The PDF is among the most common file formats for sharing information such as financial reports, research papers, technical documents, and marketing materials. However, when building effective retrieval-augmented generation (RAG) systems, extracting useful content from PDFs remains a major challenge. This is especially true for complex elements like charts, tables, and infographics. The accuracy and clarity of the extracted text directly affects how well the retriever can surface relevant context to answer user queries.
Two primary approaches have emerged for tackling this challenge: optical character recognition (OCR) pipelines and vision language models (VLMs).
- Specialized OCR pipelines: These systems, such as the NVIDIA NeMo Retriever PDF Extraction pipeline, use a multistage process that involves object detection to locate specific elements (charts, tables, and so on) and the application of specialized OCR and structure-aware models tailored to each element type.
- VLMs: These powerful, general-purpose AI models can process and interpret both images and text, offering the potential to “understand” and describe visual elements like charts and tables directly from the PDF page image. For example, Llama 3.2 11B Vision Instruct is an 11-billion-parameter multimodal version of Llama 3.2 fine-tuned to follow image-aware instructions.
RAG developers often ask when each approach makes the most sense—a specialized, multi-model pipeline, or a single, general‑purpose VLM? To answer this question, we conducted experiments comparing the NeMo Retriever pipeline against a VLM-based approach, focusing on downstream retrieval performance. Our findings suggest that for this specific retrieval task, the specialized pipeline currently offers distinct advantages in accuracy and efficiency.
This post compares the two extraction strategies, including methodology, datasets, metrics, and performance numbers, so you can decide which to use for your RAG pipeline and why.
Baseline approach: NeMo Retriever PDF Extraction
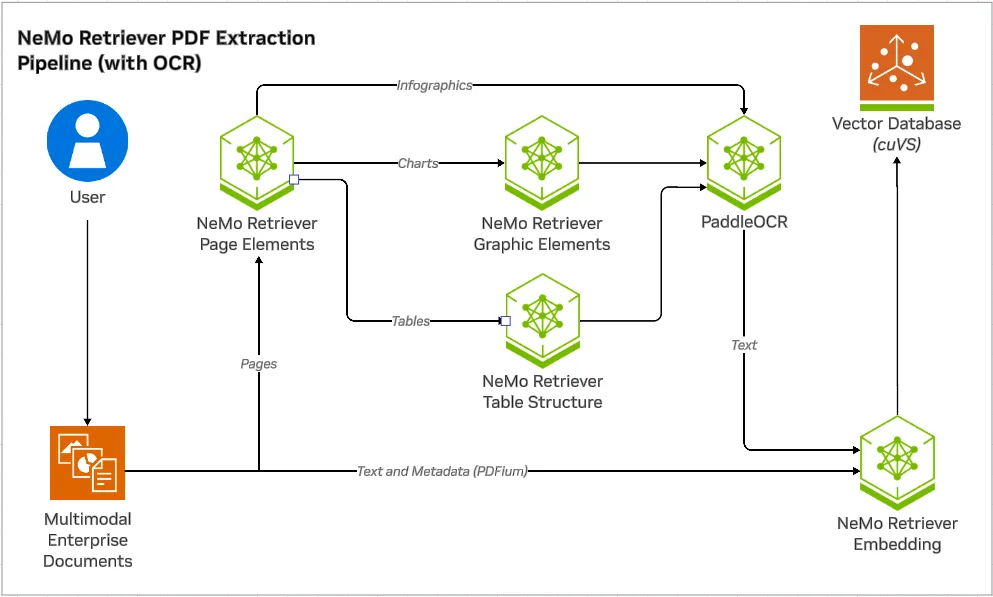
The NeMo Retriever PDF Extraction pipeline is designed for high-fidelity information extraction from PDFs. Its workflow involves the following steps:
- Page element detection: A model first identifies the locations of charts, tables, and infographics on each PDF page.
- Specialized extraction: Each detected element is then processed by a dedicated model optimized for its structure.
- Charts: A graphic-element model combined with OCR (such as PaddleOCR) extracts titles, axes, data points, and legends (chart-to-text).
- Tables: A table-structure recognition model that works with OCR to accurately parse rows, columns, and cells into Markdown format (table-to-text).
- Infographics: Since infographics are more diverse and less structured than charts and tables, only OCR is applied to extract textual content (infographic-to-text).
This modular approach aims to maximize accuracy by using tools specifically designed for the intricacies of each data type.
Alternative approach: Extracting text using a VLM
The alternative approach replaces the specialized extraction modules with a single VLM, as shown in Figure 2.

Our experiments used the Llama 3.2 11B Vision Instruct model accessed through NVIDIA NIM microservices. We prompted the VLM to describe the detected elements, as detailed below.
Chart prompt:
Describe the chart using the format below:
- Title: {Title}
- Axes: {Axis Titles}
- Data: {Data points}

Reply with empty text if no chart is present.
Table prompt:
Describe the table using markdown format. Reply with empty text if no table is present.
Provide the raw data without explanation.
Infographic prompt:
Transcribe this infographic. Only describe visual elements if essential to understanding.
If unsure about content, don't guess.
We also tested a larger Llama 3.2 90B Vision Instruct model to see if scale improved results. Inference parameters (temperature=0.5, top_p=0.95, max_tokens=1024) were kept consistent.
Experimental setup
Our core objective was to measure how well the text extracted using each approach (baseline and alternative) supports downstream retrieval.
- Datasets: Two distinct datasets were used.
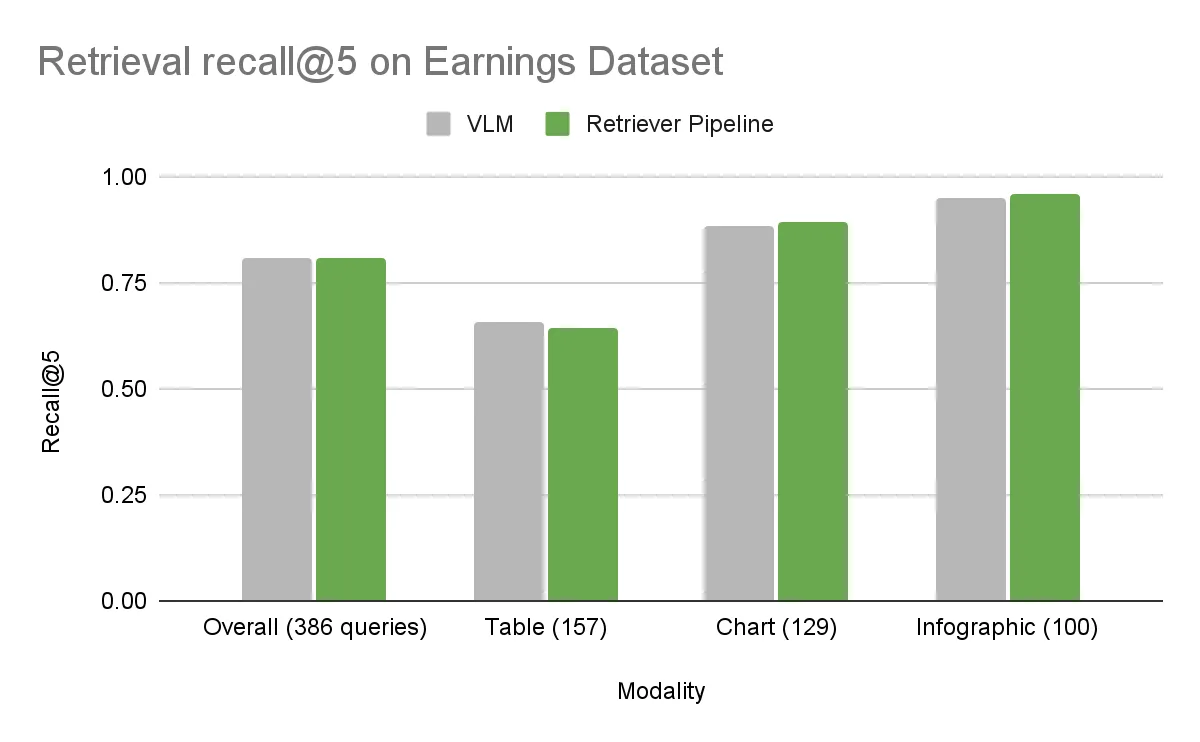
- Earnings dataset: An internal collection of 512 PDFs containing more than 3,000 instances each of charts, tables, and infographics, accompanied by more than 600 human-annotated retrieval questions.
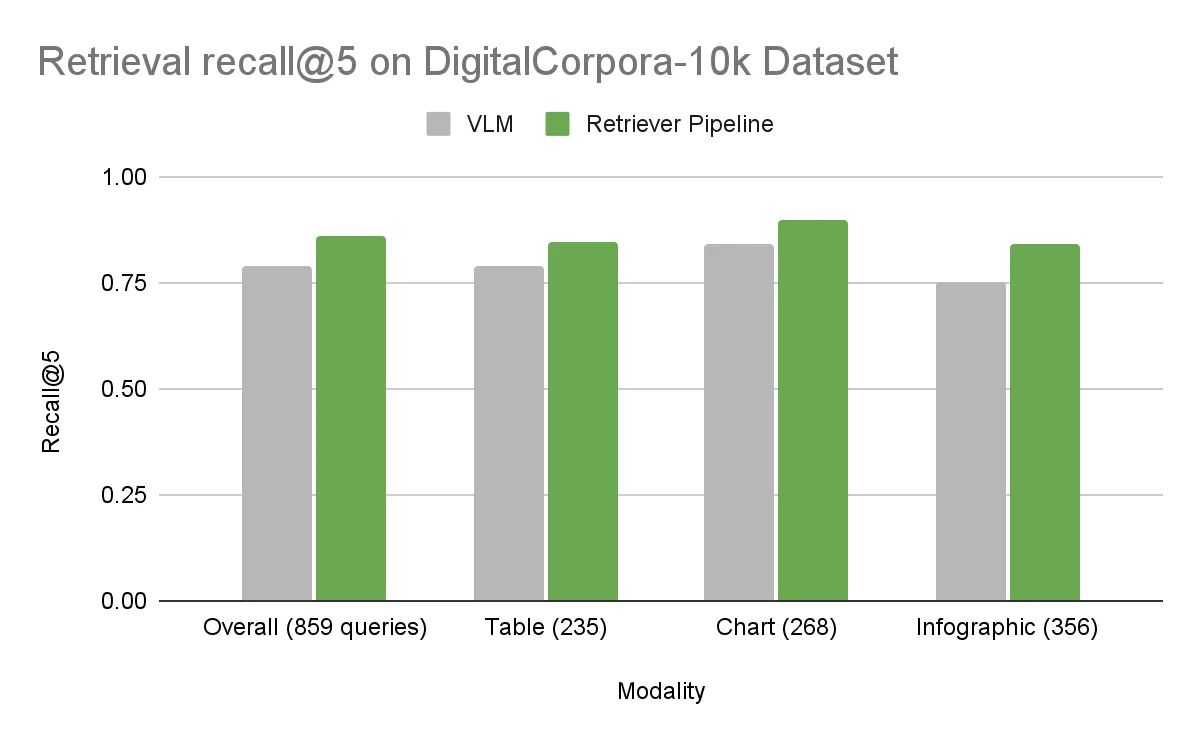
- DigitalCorpora 10K dataset: A diverse public benchmark of 10,000 PDFs from Digital Corpora with more than 1,300 human-annotated questions across text, tables, charts, and infographics.
- Evaluation metric: Recall@5 was used to measure, which is the percentage of queries for which the ground-truth page was ranked within the top five retrieved results. Higher recall means the extracted text representation is more effective for finding the right information.
- Retriever: To ensure a fair comparison of these extraction methods for subsequent text-based retrieval, we used the same embedding model (Llama 3.2 NV EmbedQA 1B v2) and ranker (Llama 3.2 NV RerankQA 1B v2) for both the baseline OCR-extracted text and VLM-generated descriptions. After either method retrieves its top-k chunks, downstream answer generation can be handled by any LLM or VLM as needed. Because that generation stage is independent of extraction, it remains outside the scope of this post.
Results: Retrieval accuracy comparison
On the Earnings dataset, the overall accuracies were essentially the same. The DigitalCorpora 10K dataset, with its broader diversity, showed a clear difference. The baseline NeMo Retriever pipeline outperformed the VLM across all visual modalities, with an overall delta of 7.2%.
Error analysis
Investigating the errors on the DigitalCorpora 10K dataset revealed common failure modes for the VLM approach.
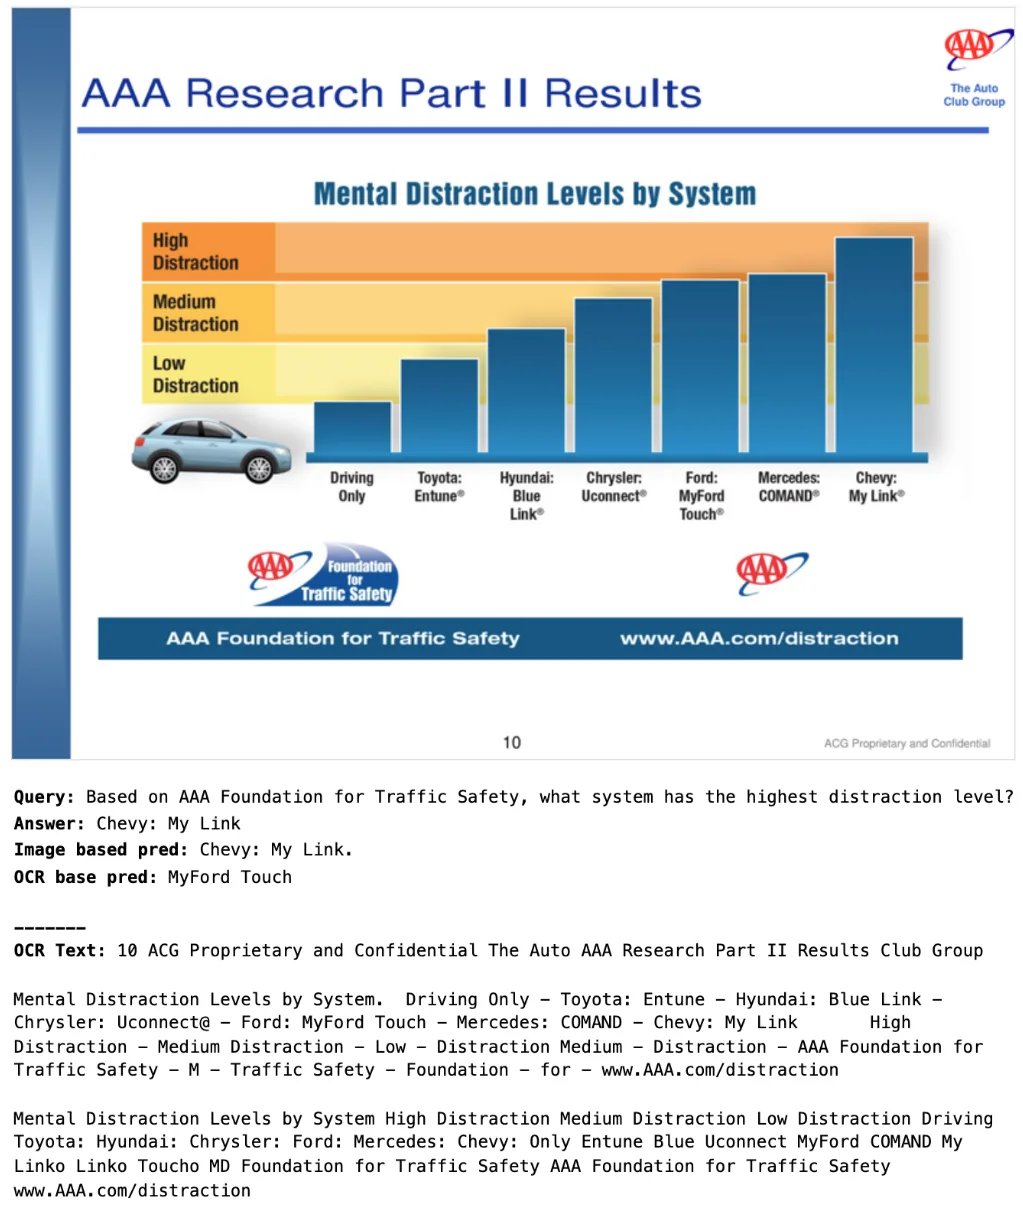
Incorrect interpretation
VLMs sometimes misinterpret the visual elements. For example, confusing chart types (line versus bar), misreading axis labels or data points, or failing to understand the main message of a chart. In this example, the VLM description extracted the wrong title, was confused between line and bar plots, and didn’t capture y-axis values.
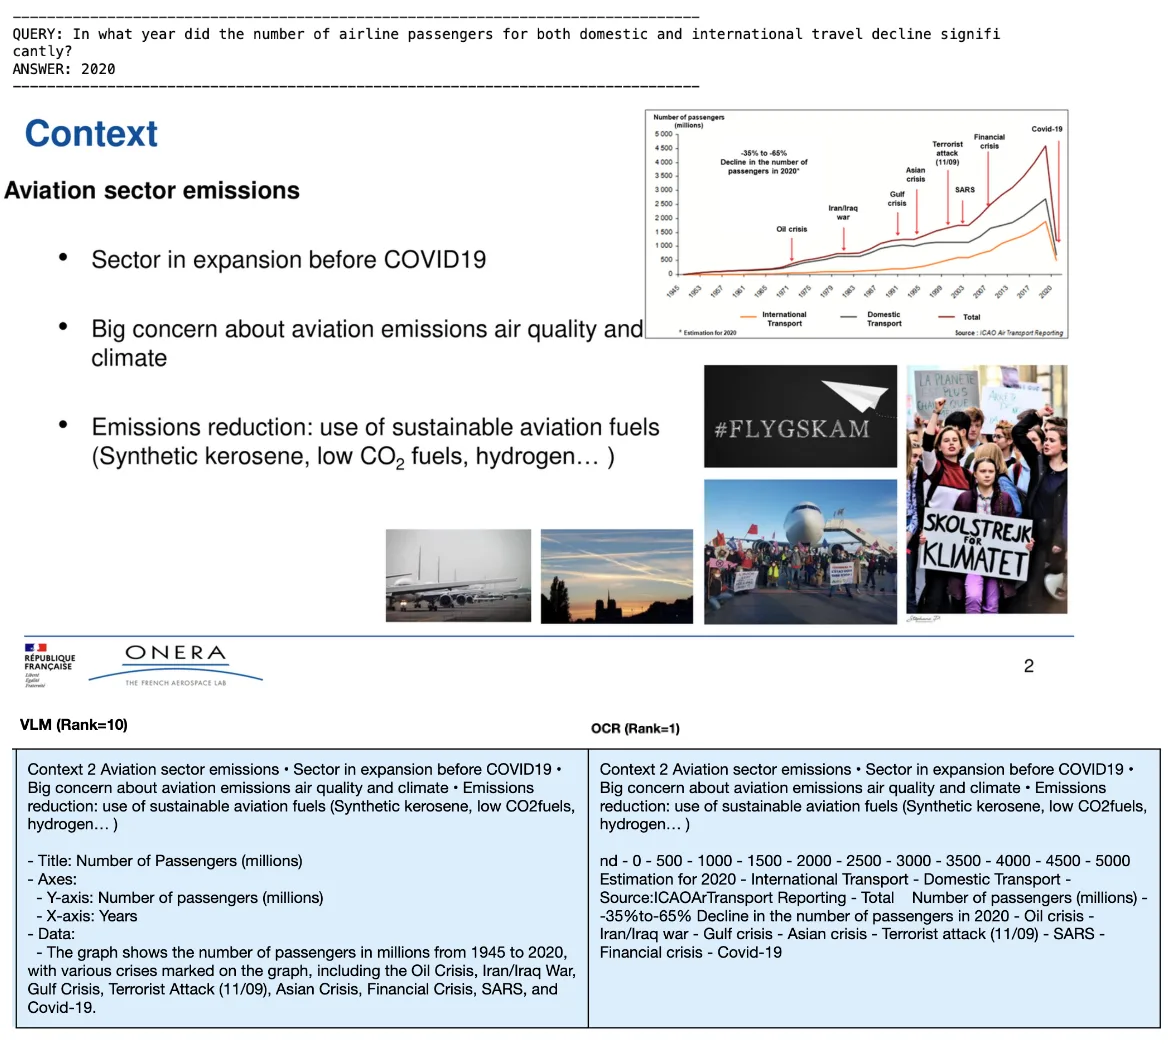
Failure to extract embedded text
Critical text annotations, detailed legends, or specific data within charts or infographics were sometimes missed by the VLM, whereas OCR-based methods excel at capturing this text. In this example, the VLM didn’t extract key embedded text from the chart, “35% to 65% decline in the number of passengers in 2020.”
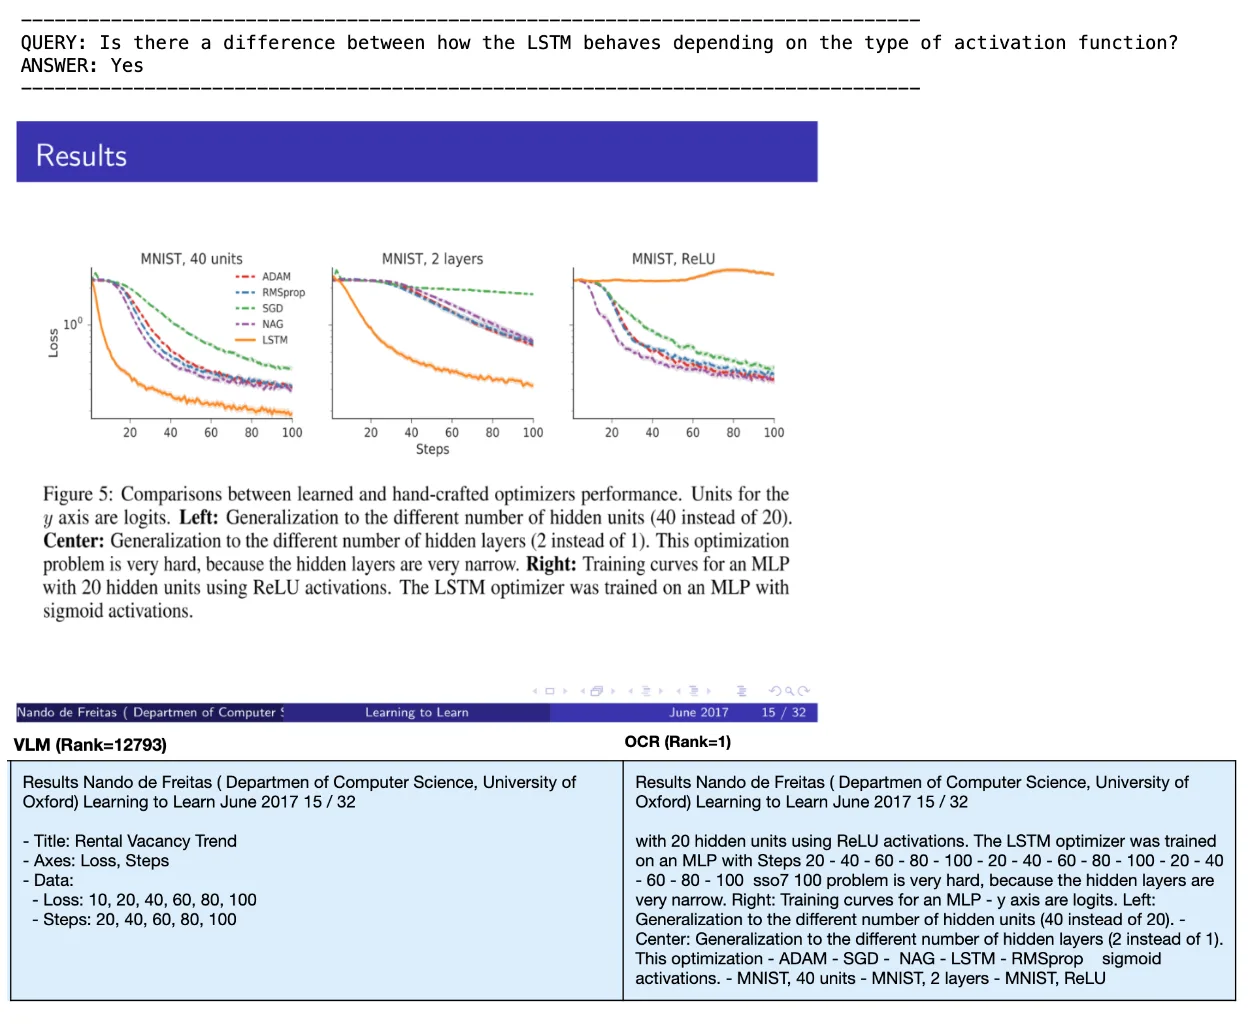
Hallucinations and repetitions
In some cases, the VLM-generated descriptions contain fabricated details (hallucinations) or repeated phrases unnecessarily, adding noise to the text representation. In this case, the VLM hallucinated the title Rental Vacancy Trend and didn’t capture the figure description.
Incomplete extraction
For tables, the VLM sometimes failed to capture the entire structure or omitted rows/columns, as seen in some Earnings dataset examples, where only parts of the table data were transcribed.
In contrast, the specialized models in the NeMo Retriever pipeline are designed to handle these specific structures and extract text through OCR, leading to more faithful and complete representations for retrieval.
Efficiency and practical considerations
Beyond accuracy, real-world deployment depends on how quickly and cost-effectively millions of pages can be processed.
Latency affects how fast new documents show up in search results. Throughput impacts how many machines you need and how much you spend. Token counts can increase costs during embedding and reranking. To compare, we measured both pipelines on latency, pages-per-second throughput, and token usage.
Performance
We benchmarked the end-to-end latency and throughput performance of both pipelines on a single NVIDIA A100 GPU. The OCR pipeline has an end-to-end latency of 0.118 seconds per page, including converting PDF pages into images, detecting elements on a page, and extracting text from the elements.
The Llama 3.2 11B Vision Instruct VLM has average inference times of 2.58 seconds per chart image, 6.86 seconds per table image, and 6.60 seconds per infographic image. Overall, the average processing time for just the image-to-text step is 3.81 seconds per page on the entire DigitalCorpora 10K dataset across all 213,000 pages. Note that not all pages contain a chart, table, or infographic.
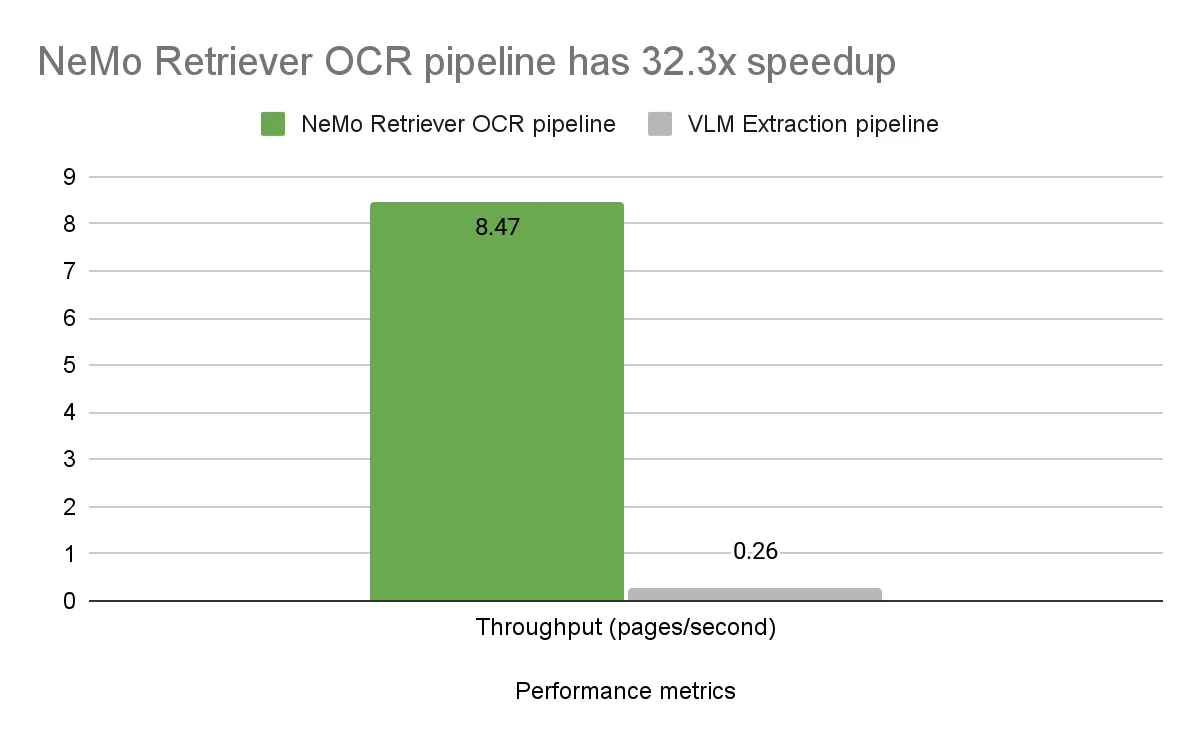
The NeMo Retriever OCR pipeline with relatively tiny models demonstrates significantly higher throughput, 32.3x, and lower latency compared to the much larger VLM model.
Token usage
We observed that VLM descriptions, particularly for infographics, often produced significantly more tokens than the OCR baseline. The VLM tended to describe visual layouts and add narrative, whereas the OCR approach focused on transcribing the text content. This increased verbosity can lead to higher inference costs during the retrieval stage–embedding and optionally reranking.
Consistency
While VLM outputs can vary (even slightly different with fixed seeds due to non-deterministic factors), the deterministic nature of object detection and OCR models offers higher result consistency.
Additional observations
A few additional observations are detailed below.
Using a larger VLM
We tested replacing the 11-billion-parameter Llama 3.2 Vision model with its 90-billion version, Llama 3.2 90B Vision Instruct. Counterintuitively, this change did not lead to an improvement in retrieval recall performance on our datasets. This demonstrates that the medium-sized 11B model is a strong VLM sufficient for this specific task.
Role of prompts
VLM performance is known to be sensitive to prompting. While our experiments used general prompts to evaluate out-of-the-box performance, careful prompt engineering and model fine-tuning could potentially help close the accuracy gap between the VLM and our specialized OCR pipeline, though without reducing the throughput gap.
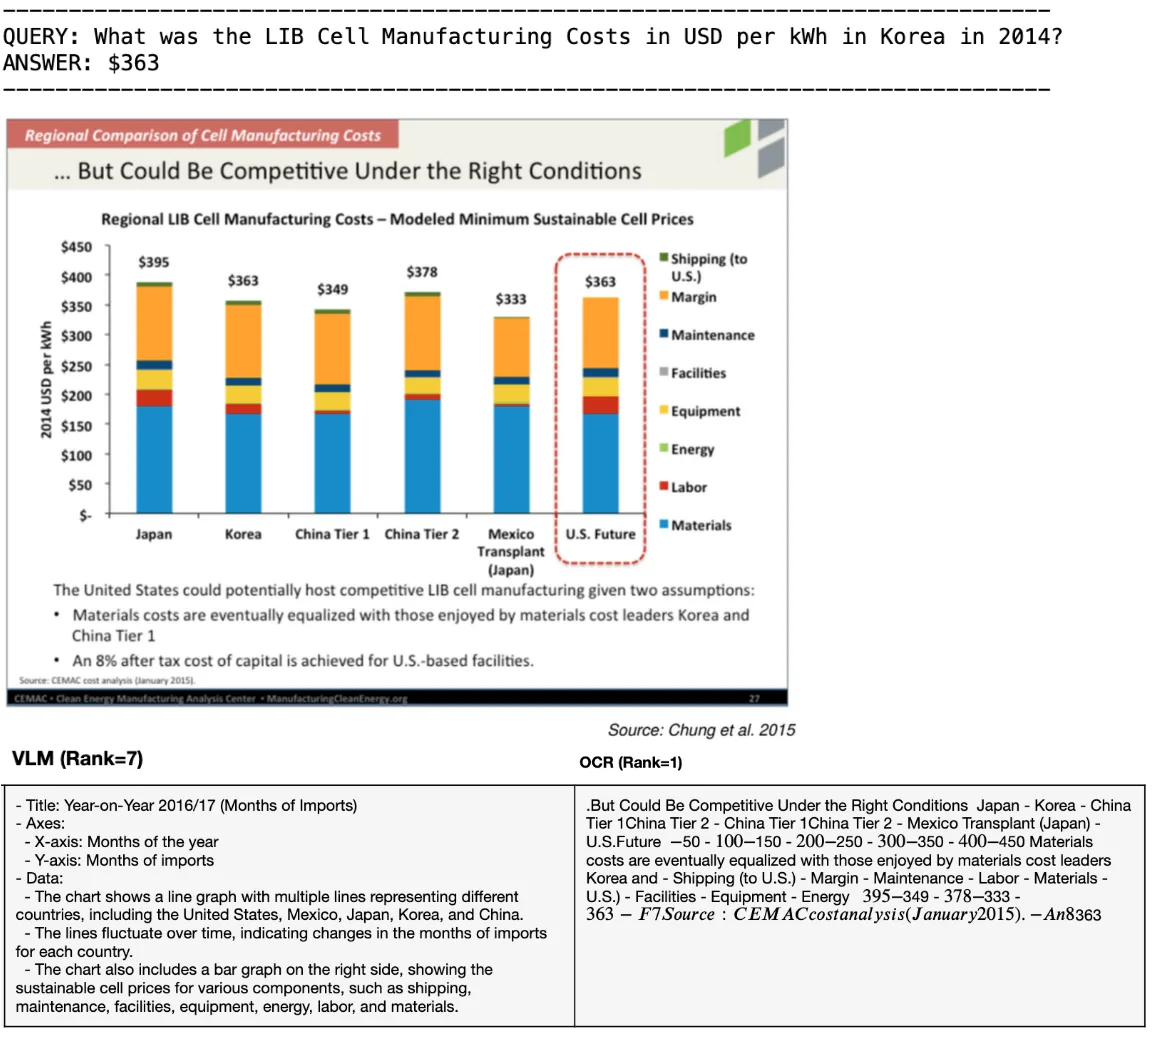
Limits of OCR
An interesting observation for future exploration involves scenarios where OCR approaches reach limitations, particularly when extracting information that isn’t explicitly annotated, such as reading bar heights from charts without numerical labels. For example, in a preliminary experiment, we saw a case where OCR plus a text-only LLM (Llama 3.1 Nemotron 70B Instruct) retrieved the correct page but failed to produce the correct answer.
In contrast, a similarly-sized VLM (Llama 3.2 90B Vision Instruct) directly answered correctly using the visual input. This illustrates an area where VLMs have unique advantages. Future investigations could systematically evaluate the complementary strengths of OCR and VLM approaches for such multimodal generation tasks.
Conclusion
We compared two approaches to extracting information from complex PDF elements (charts, tables, and infographics) for downstream text-based retrieval:
- A specialized OCR-based approach: NVIDIA NeMo Retriever PDF Extraction pipeline
- A general-purpose VLM-based approach with Llama 3.2 11B Vision Instruct
We benchmarked both methods as part of a retrieval pipeline. Although not specifically designed for PDF-to-text extraction, VLMs demonstrated promising document parsing abilities without additional fine-tuning. The OCR-based NeMo Retriever pipeline achieved higher retrieval recall on our tested datasets, while also delivering strong performance advantages in throughput, processing speed, and inference efficiency.
NVIDIA provides developers with a range of options through NIM microservices, including both highly optimized models for specialized extraction tasks and powerful, general-purpose VLMs, enabling users to select the best approach for their specific needs. It’s also important to note that both specialized extraction models and VLMs are rapidly evolving, and the landscape for document understanding will continue to change.
While this analysis has focused on the retrieval portion of the RAG pipeline, where OCR methods currently demonstrate clear benefits, there are complementary use cases, such as direct answer generation from complex visual content, where VLMs have unique strengths. We plan to explore the complementary strengths of VLMs in a future post.
Get started with the NVIDIA RAG Blueprint
Ready to optimize your PDF extraction strategies discussed in this post? Try the NVIDIA AI Blueprint for RAG, a reference solution for a foundational RAG pipeline. This enterprise-grade reference implementation provides all the components you need to:
- Experiment with different PDF extraction approaches using your datasets.
- Leverage state-of-the-art embedding and embedding reranking models.
- Build a production-ready PDF extraction pipeline with minimal development time.
