NVIDIA Nsight Compute - 2020.2
NVIDIA® Nsight™ Compute is an interactive kernel profiler for CUDA applications. It provides detailed performance metrics and API debugging via a user interface and command line tool. In addition, its baseline feature allows users to compare results within the tool. Nsight Compute provides a customizable and data-driven user interface and metric collection and can be extended with analysis scripts for post-processing results.
Version 2020.2 New Features | Revision History

- Rooflines provide a visual representation memory and compute capacities of your system.
- Analysis pinpoints your achieved arithmetic intensity and FLOP performance with respect to these limitations.
- This visualization guides the direction and value of optimization efforts
- For more information, see our

Memory Workload Analysis
- Visualize Memory throughput on the profiled platform and follow guided analysis for improving performance
- For NVIDIA Ampere and later architectures:
- Sparse Data Compression throughput and ratio, to ensure data is compacted for maximum performance
- Asynchronous Copy metrics, validates the most direct route to shared memory
- View our 2020.1 Spotlight, GTC 2020, and Super Computing 2020 videos
- Read our "NVIDIA Ampere Architecture and NVIDIA Nsight Developer Tools" blog

- Set multiple baselines to compare variations in GPU architecture, kernel launch parameters, memory usage, ...
- Compare performance metrics between baselines and the current run, including the ability to compare child processes

Run from Nsight Compute GUI or from Console Command Line
- Nsight Compute GUI provides text for console commands
- GUI/Console provide similar features, functionality, output, and reports

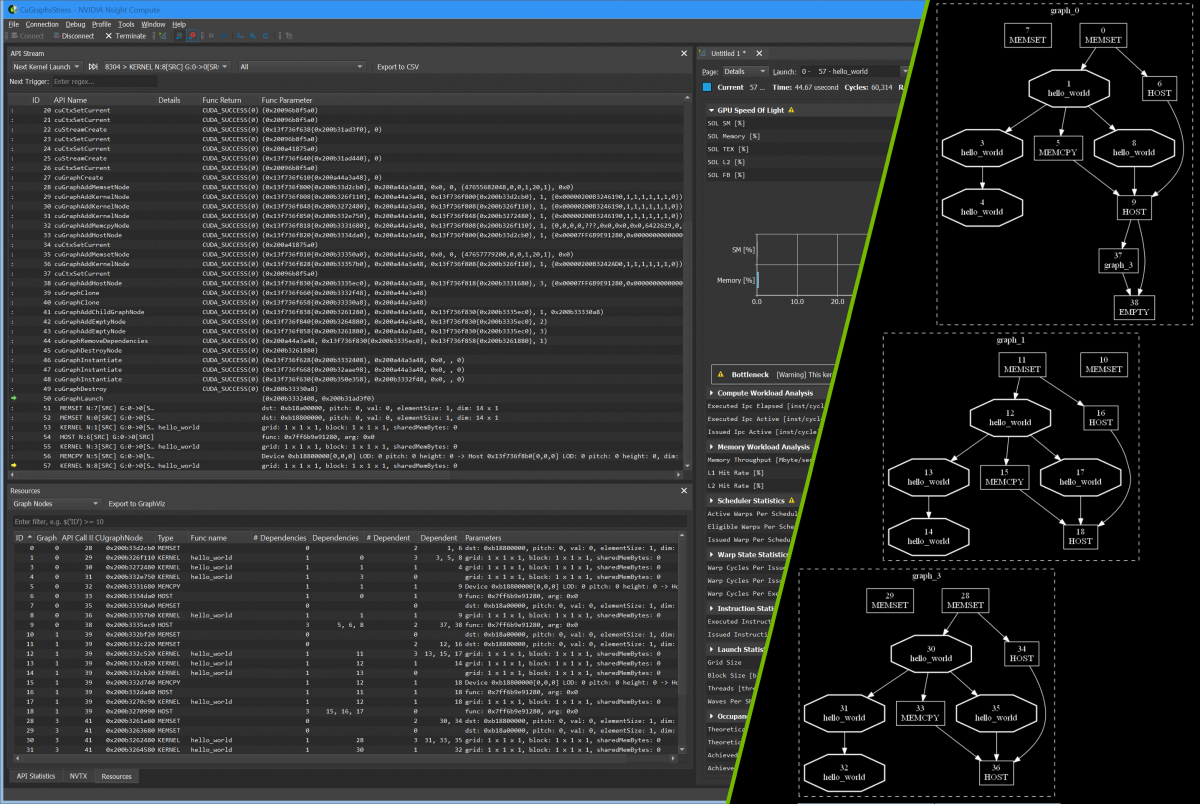
CUDA Task Graph Profiling
- Stop at a kernel launch from a graph node
- State of graph node shown in resource page
- Export graph visualization

- Correlate individual Source, SASS, or PTX lines and metrics
- Shown here with PC Sampling data available in Volta and Turing architectures
- Heat map for identifying high metric values

Nsight Compute integrates into Visual Studio using NVIDIA Nsight Integration
Visual Studio project settings are transferred to the Nsight Compute
Features
- Interactive kernel profiler
- Profiler report for kernels and/or child processes
- Diff’ing results across one or multiple reports using baselines
- Roofline Analysis to visualize performance headroom
- Fast data collection
- Intuitive UI for interactive profiling
- Command line operation for manual and automated profiling
- Fully customizable reports and rules
Variations from the Nsight Compute 2020.2 found in CUDA Toolkit 11.1
- This version is a reposting of the version in the CUDA ToolKit 11.1.
- A MacOS host download is available here, but not included in the CUDA Toolkit.
- We may update this site with bug fixes, as needed.
System Requirements
Supported platforms
- Linux x86_64[1]
- Windows x86_64[1]
- MacOS[1]
- Linux x86_64[1]
- Windows x86_64[1]
- Linux PowerPC[1]
- Linux aarch64 sbsa[1]
- DRIVE OS QNX aarch64[2][3]
- DRIVE OS Linux aarch64[2][3]
Host
Target
Supported NVIDIA GPU architectures
- Ampere: A100 with Multi-Instance GPU, GA10x
- Turing: TU1xx
- Volta: GV100[1], GV10B[2]
Drivers
-
Please use the the following drivers
- 456.33 (Windows)
- 455.23.02 (Linux)
[2] available in the Embedded or Drive toolkits only
[3] Only the command line interface (CLI) is provided for these platforms. There is no Nsight Compute GUI application for these platforms
Documentation, Videos, and Blogs
Nsight Compute Documentation
Videos
Blogs
Support
To provide feedback, request additional features, or report Nsight Compute issues, please use the Developer Forums