NVIDIA Nsight Compute 2019.3
NVIDIA® Nsight™ Compute is an interactive kernel profiler for CUDA applications. It provides detailed performance metrics and API debugging via a user interface and command line tool. In addition, its baseline feature allows users to compare results within the tool. Nsight Compute provides a customizable and data-driven user interface and metric collection and can be extended with analysis scripts for post-processing results.
Version 2019.3 New Features | Revision History

Baseline Comparisons
- Set multiple baselines to compare variations in GPU architecture, kernel launch parameters, memory usage, ...
- Compare performance metrics between baselines and the current run
- New: Now with the ability to compare child processes

Run from NsCompute GUI or from Console Command Line
- NsCompute GUI provides text for console commands
- GUI/Console provide similar features, functionality, output, and reports

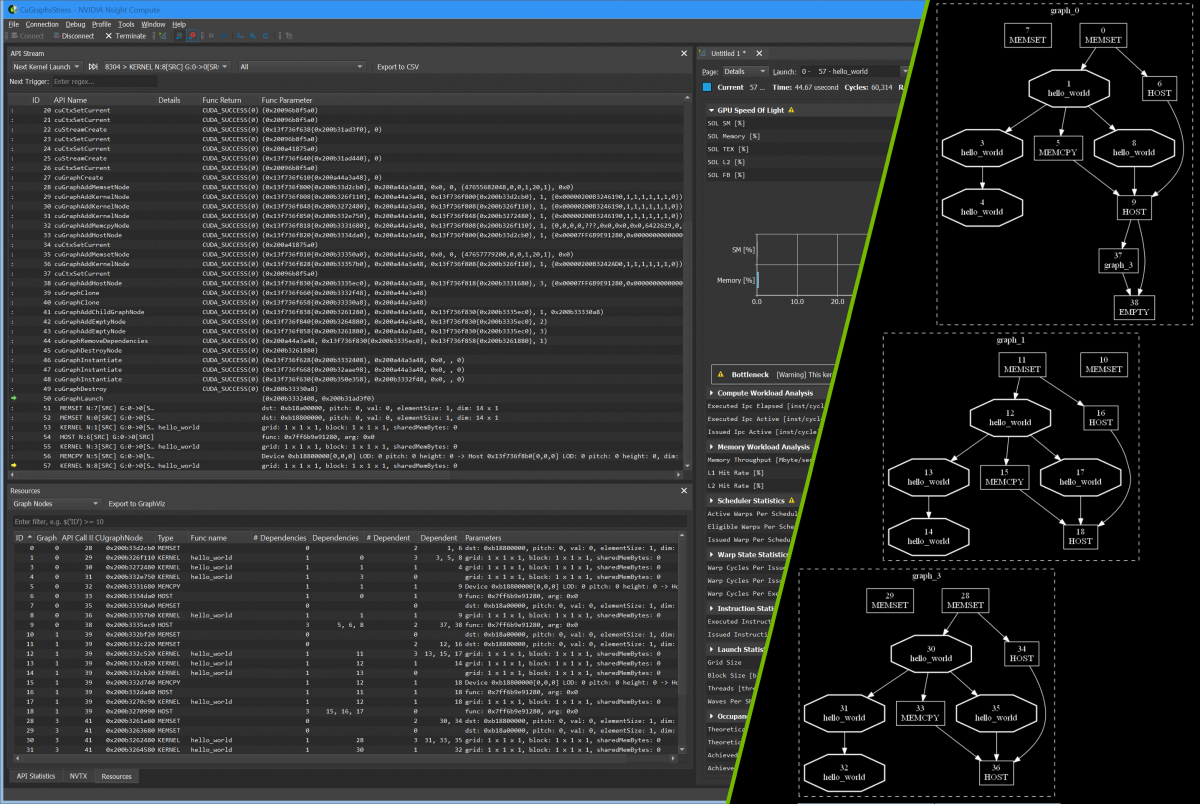
CUDA 10.1 Update 1 Task Graph Profiling
- Stop at a kernel launch from a graph node
- State of graph node shown in resource page
- Export graph visualization

Source Code Correlation
- Correlate individual Source, SASS, or PTX lines and metrics
- Shown here with PC Sampling data available in Volta and Turing architectures
- New: Improved heat map for identifying high metric values
Features
- Interactive kernel profiler
- Profiler report for kernels and/or child processes
- Diff’ing results across one or multiple reports using baselines
- Fast data collection
- Intuitive UI for interactive profiling
- Command line operation for manual and automated profiling
- Fully customizable reports and rules
Variations from the Nsight Compute 2019.3.0 found in
CUDA Toolkit 10.1 Update 1
-
2019.3.1 Improvements:
- New 'Send Feedback...' button under 'Help' menu
- Fixed calculation of theoretical occupancy for grids with blocks that are not a multiple of 32 threads
- Fixed intercepting child processes launched through Python's subprocess.Popen() class on Linux
- Fixed issue of NVTX push/pop ranges not showing up for child threads when using Nsight Compute command line tools
- Fixed description in rule covering the IMC stall reason
- Fixed cases were baseline values were not correctly calculated when comparing reports of different architectures
- Fixed accessing instanced metrics in the NvRules API
- Fixed a bug that could cause the collection of unnecessary metrics in the Interactive Profile activity
- Fixed potential crash on exit of the profiled target application
- Switched underlying metric for SOL FB in the GPU Speed Of Light section to be driven by dram__throughput.avg.pct_of_peak_sustained_elapsed instead of fbpa__throughput.avg.pct_of_peak_sustained_elapsed
- Improved performance for metric lookups on the Source page
System Requirements
Supported platforms
Host
- Linux x86_64[1]
- Windows x86_64[1]
- MacOS[1]
Target
- Linux x86_64[1]
- Windows x86_64[1]
- DRIVE OS QNX aarch64[2][3]
- DRIVE OS Linux aarch64[2][3]
[2] available in the Embedded or Drive toolkits only
[3] Only the command line interface (CLI) is provided for these platforms. There is no Nsight Compute GUI application for these platforms
Supported GPU architectures
- Pascal: GP10x (excluding GP100)
- Volta: GV100
- Turing: TU1xx
Drivers
- Please use the 425.25 drivers provided with CUDA Toolkit 10.1 Update 1 production release or a more recent version.
Documentation
Support
To provide feedback, request additional features, or report Nsight Compute issues, please use the Developer Forums