NVIDIA PhysX
Modeling digital twins of factories, cities, or entire worlds involves complex simulations that must accurately replicate the physical behavior of objects and systems, which are foundational in building physical AI for powering the next generation of autonomous systems.
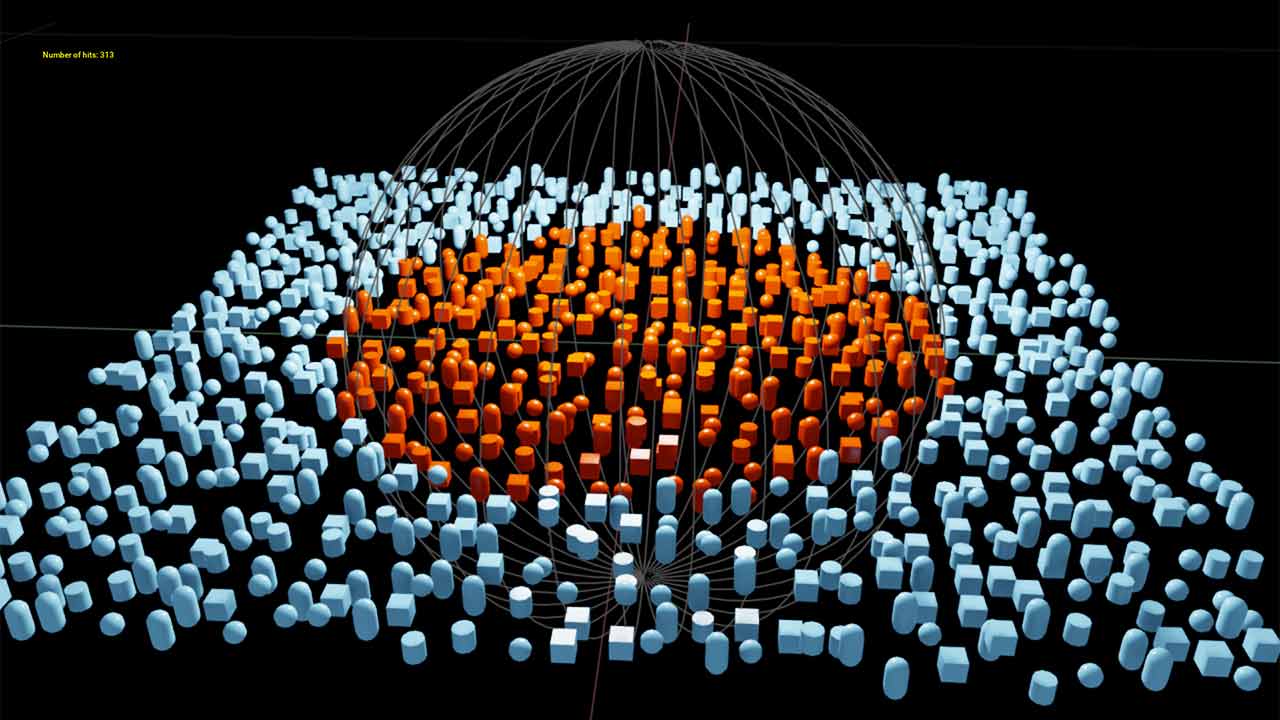
NVIDIA PhysX® is a powerful, open-source multi-physics SDK that provides scalable simulation and modeling capabilities for robotics and autonomous vehicle applications.
Get PhysX in Omniverse
Get PhysX Source on GitHub
Documentation
PhysX based simulation of robots screwing nuts onto bolts, in Omniverse.
Key Benefits of PhysX
Open-Source
PhysX is fully open-source, enabling free use and sharing of your work with other developers, as well as contributing your innovative developments back to the community.
Unified
Model FEM soft body, cloth, particles, and fluid simulation with two-way coupled interactions under a unified solver framework.
Scalable
Runs on various platforms, from mobile CPUs to high-end GPUs, with a GPU API supporting end-to-end
reinforcement learning via NVIDIA Isaac™ Lab.
Accurate
Enhanced simulation stability with robust collision detection, stacking, and joints, while also supporting momentum conservation and gyroscopic forces.
PhysX Features
Rigid Body Dynamics
Analyze multi-body dynamics under external forces like gravity. PhysX offers scalable rigid-body simulation for CPU and GPU, with proven industry performance.
Scene Query
Conduct spatial queries in simulated environments using the PhysX raycast, overlap, and sweep functions with customizable filtering.
Joints
Utilize a suite of common built-in joint types and support custom joints in PhysX through a flexible callback mechanism.
Reduced Coordinate Articulations
Reduced coordinate articulations provide a linear-time, guaranteed joint-error-free simulation of a tree of rigid bodies.
Vehicle Dynamics
Study the movement of multi-body interactions under external forces, such as gravity. PhysX provides industry-proven scalable rigid body simulation on both CPU and GPU.
Character Controllers
The kinematic character controller in PhysX permits an avatar to navigate a simulated world and supports both static and dynamically simulated bodies.
Soft Body Dynamics
Finite Element Method (FEM) simulation of soft bodies allows for accurate and efficient models of elastic deformable bodies.
SDF Colliders
A new Signed Distance Field based collision representation allows PhysX to simulate non-convex shapes like gears and cams without convex decomposition.
Position-Based Dynamics
Position-Based Dynamics provide a flexible framework for simulating a wide range of phenomena including liquids, granular materials, cloth, rigid bodies, deformable bodies, and more.
Custom Geometry
Utilize a wide range of built-in geometries and a flexible callback mechanism to allow custom geometry types into the simulation.
Fracture & Destruction
Blast, available in PhysX, is a destruction and fracture library designed for performance, scalability, and flexibility.
Smoke & Fire
Flow enables realistic combustible fluid, smoke, and fire simulations. Flow is part of the PhysX SDK.
Newton, the Next-Generation Open-Source Physics Simulation Engine
Newton is an open-source, GPU-accelerated, and extensible physics engine, co-developed by Google DeepMind and Disney Research, and managed by the Linux Foundation. Built on NVIDIA Warp and OpenUSD, Newton is optimized for robotics and compatible with learning frameworks such as MuJoCo Playground or NVIDIA Isaac Lab. Newton Beta is now available to use.
PhysX Implementation
CPUs |
NVIDIA GPUs |
|
|---|---|---|
Character Controllers |
||
Custom Geometries |
||
Fracture and Destruction - PhysX Blast |
||
Joints |
||
PBD (liquid/cloth/inflatable/shape matching) |
||
Reduced Coordinate Articulations |
||
Rigid Body Dynamics |
||
Scene Queries |
||
Smoke and Fire - PhysX Flow |
||
Soft Body Dynamics (Finite Element Method) |
||
Vehicle Dynamics |
See PhysX in Action
PhysX News
Resources
More Resources
PhysX in NVIDIA Omniverse
PhysX is the primary physics engine of NVIDIA Omniverse™, a platform of APIs and SDKs for building complex 3D and industrial digitalization workflows based on OpenUSD. NVIDIA Isaac Sim™ and Isaac Lab are two robotics reference applications built on Omniverse, which enable developers to build physical AI to power next-generation robots.