Parallel Nsight 2.1 - New Features
For a complete overview of all Parallel Nsight features and access to resources, please visit the main Parallel Nsight page.
*New* 2.1 Features:
Parallel Nsight 2.1 dramatically improves DirectX and OpenGL Graphics development and CUDA development through the comprehensive set of new features listed below.
Graphics Debugging and Profiling
- Dynamic Shader Editing within the Visual Studio code editor to allow the developer to override shaders while the application is still running and debug the edited shader with Nsight’s powerful Pixel History feature.
- Drawcall page can now show constant buffer with HLSL variable names.
- New Frame Timings page allows DirectX developers to get to the exact measured DrawCall timings in isolation or in concurrent execution of the GPU.
- Frame profiler sessions can be saved and restored. This allows for sharing profiling results with team members.
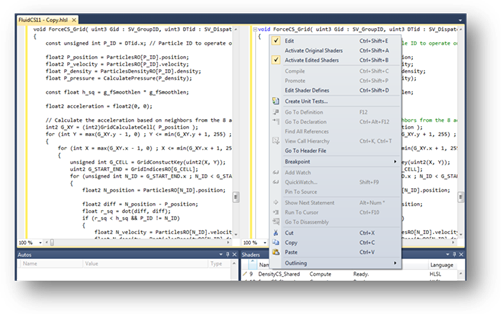
Figure 1: Dynamic Shader Editing and its ability to swap shaders on the fly
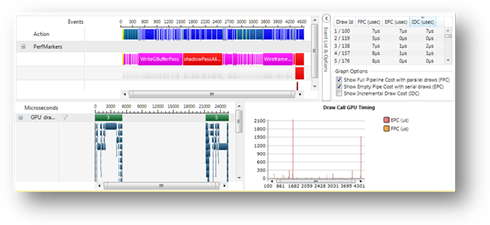
Figure 2: Parallel Nsight 2.1 DirectX Frame Timings page
Compute Debugging and Profiling
- Support for CUDA Toolkit 4.1 (available here)
- The new CUDA Parallel warp watch provides an even more efficient way to navigate through the resident threads and visualize the thread states across a warp.
- The new CUDA information tool window gives detailed information about the state of CUDA launches in the user’s application. Users can filter and find detailed information about exceptions, asserts, breakpoints, MMU faults, and easily switch to a specific warp of interest to debug problems.
- The new System information page allows system information to be available with the connection to the monitor and gives more detailed information for all the CUDA devices such as driver model, GPU architecture, memory and more...
- The new CUDA Debugger now supports debugging asynchronous kernel launches which results in a dramatic performance improvement while debugging complex CUDA applications.
- Ability to GPU break on assert.
-
New CUDA profiling and experiments that allow developers to understand performance issues caused by the following factors:
-
- Thread divergence or code branches
-
- Memory statistics
-
- Statistics on stall reasons
-
- Instruction issue efficiency
-
- Achieved FLOPS
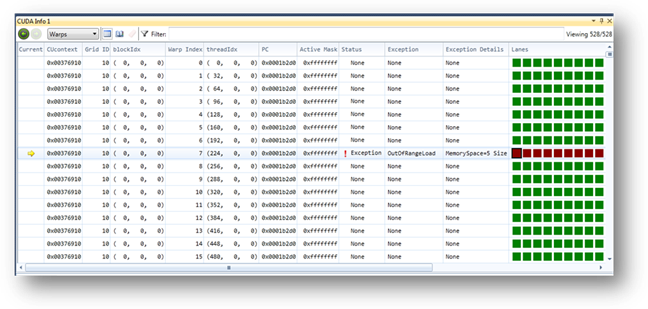
Figure 3: CUDA information tool window reporting an error detected by the memory checker
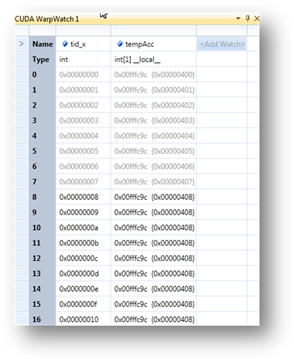
Figure 4 CUDA parallel warp watch
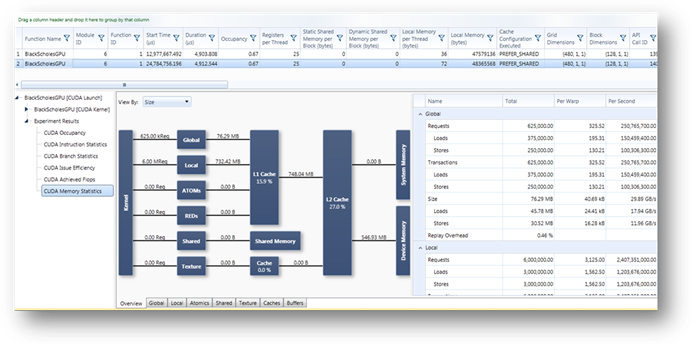
Figure 5: Advanced CUDA profiler memory experiments
Application and System Trace
- Support for CUDA Toolkit 4.1 (available here)
- Traced workloads can now navigate the dependencies and call stack to allow the developer to follow through GPU workloads, corresponding API calls and host code that was the cause of the activity.
- Tracing overhead has been reduced by a factor of 5
- Trace support for DirectX workloads, memory transfers and correlation of these back to pushbuffers and API calls.
- CUDA Trace adds support for concurrent trace of memory copies and memory sets.
- OpenGL Trace adds support for tracing GPU frames and adds a new OpenGL Frames page.
- System trace adds support for capturing data from a 64-bit process launched from a 32-bit process.
- OpenCL 1.1 API trace support
- NVTX and Direct3D Performance Marker report pages now support statistics display for all CUDA, OpenCL, Direct3D, and OpenGL API calls made during a range as well as for all GPU work submitted by the API calls.
- New correlation pane allows mining of data selected in tables or the timeline.
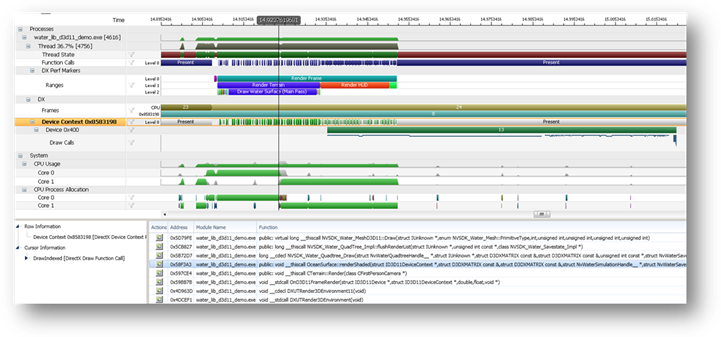
Figure 6: The new Parallel Nsight 2.1 trace supports call stack capture