

Device Tree Visualizer Tool#
The Device Tree Visualizer is a web-based tool for exploring compiled Device Tree Source (DTS) files. It allows you to trace each property to its original source file and line number, view configuration metadata, and navigate the include hierarchy.
When working with device trees, the following tasks can be difficult without dedicated tooling:
Traceability – Determining whether a change is present in the final DTB, and identifying the source file and line number for a given property.
Configuration – Checking whether a property is customer-configurable and viewing its associated metadata, which may be spread across multiple YAML files.
Structure – Understanding the include hierarchy when a single DTS file includes many DTSI files.
The Device Tree Visualizer addresses these by combining DT annotations with schema bindings to present all of this information in one interface.
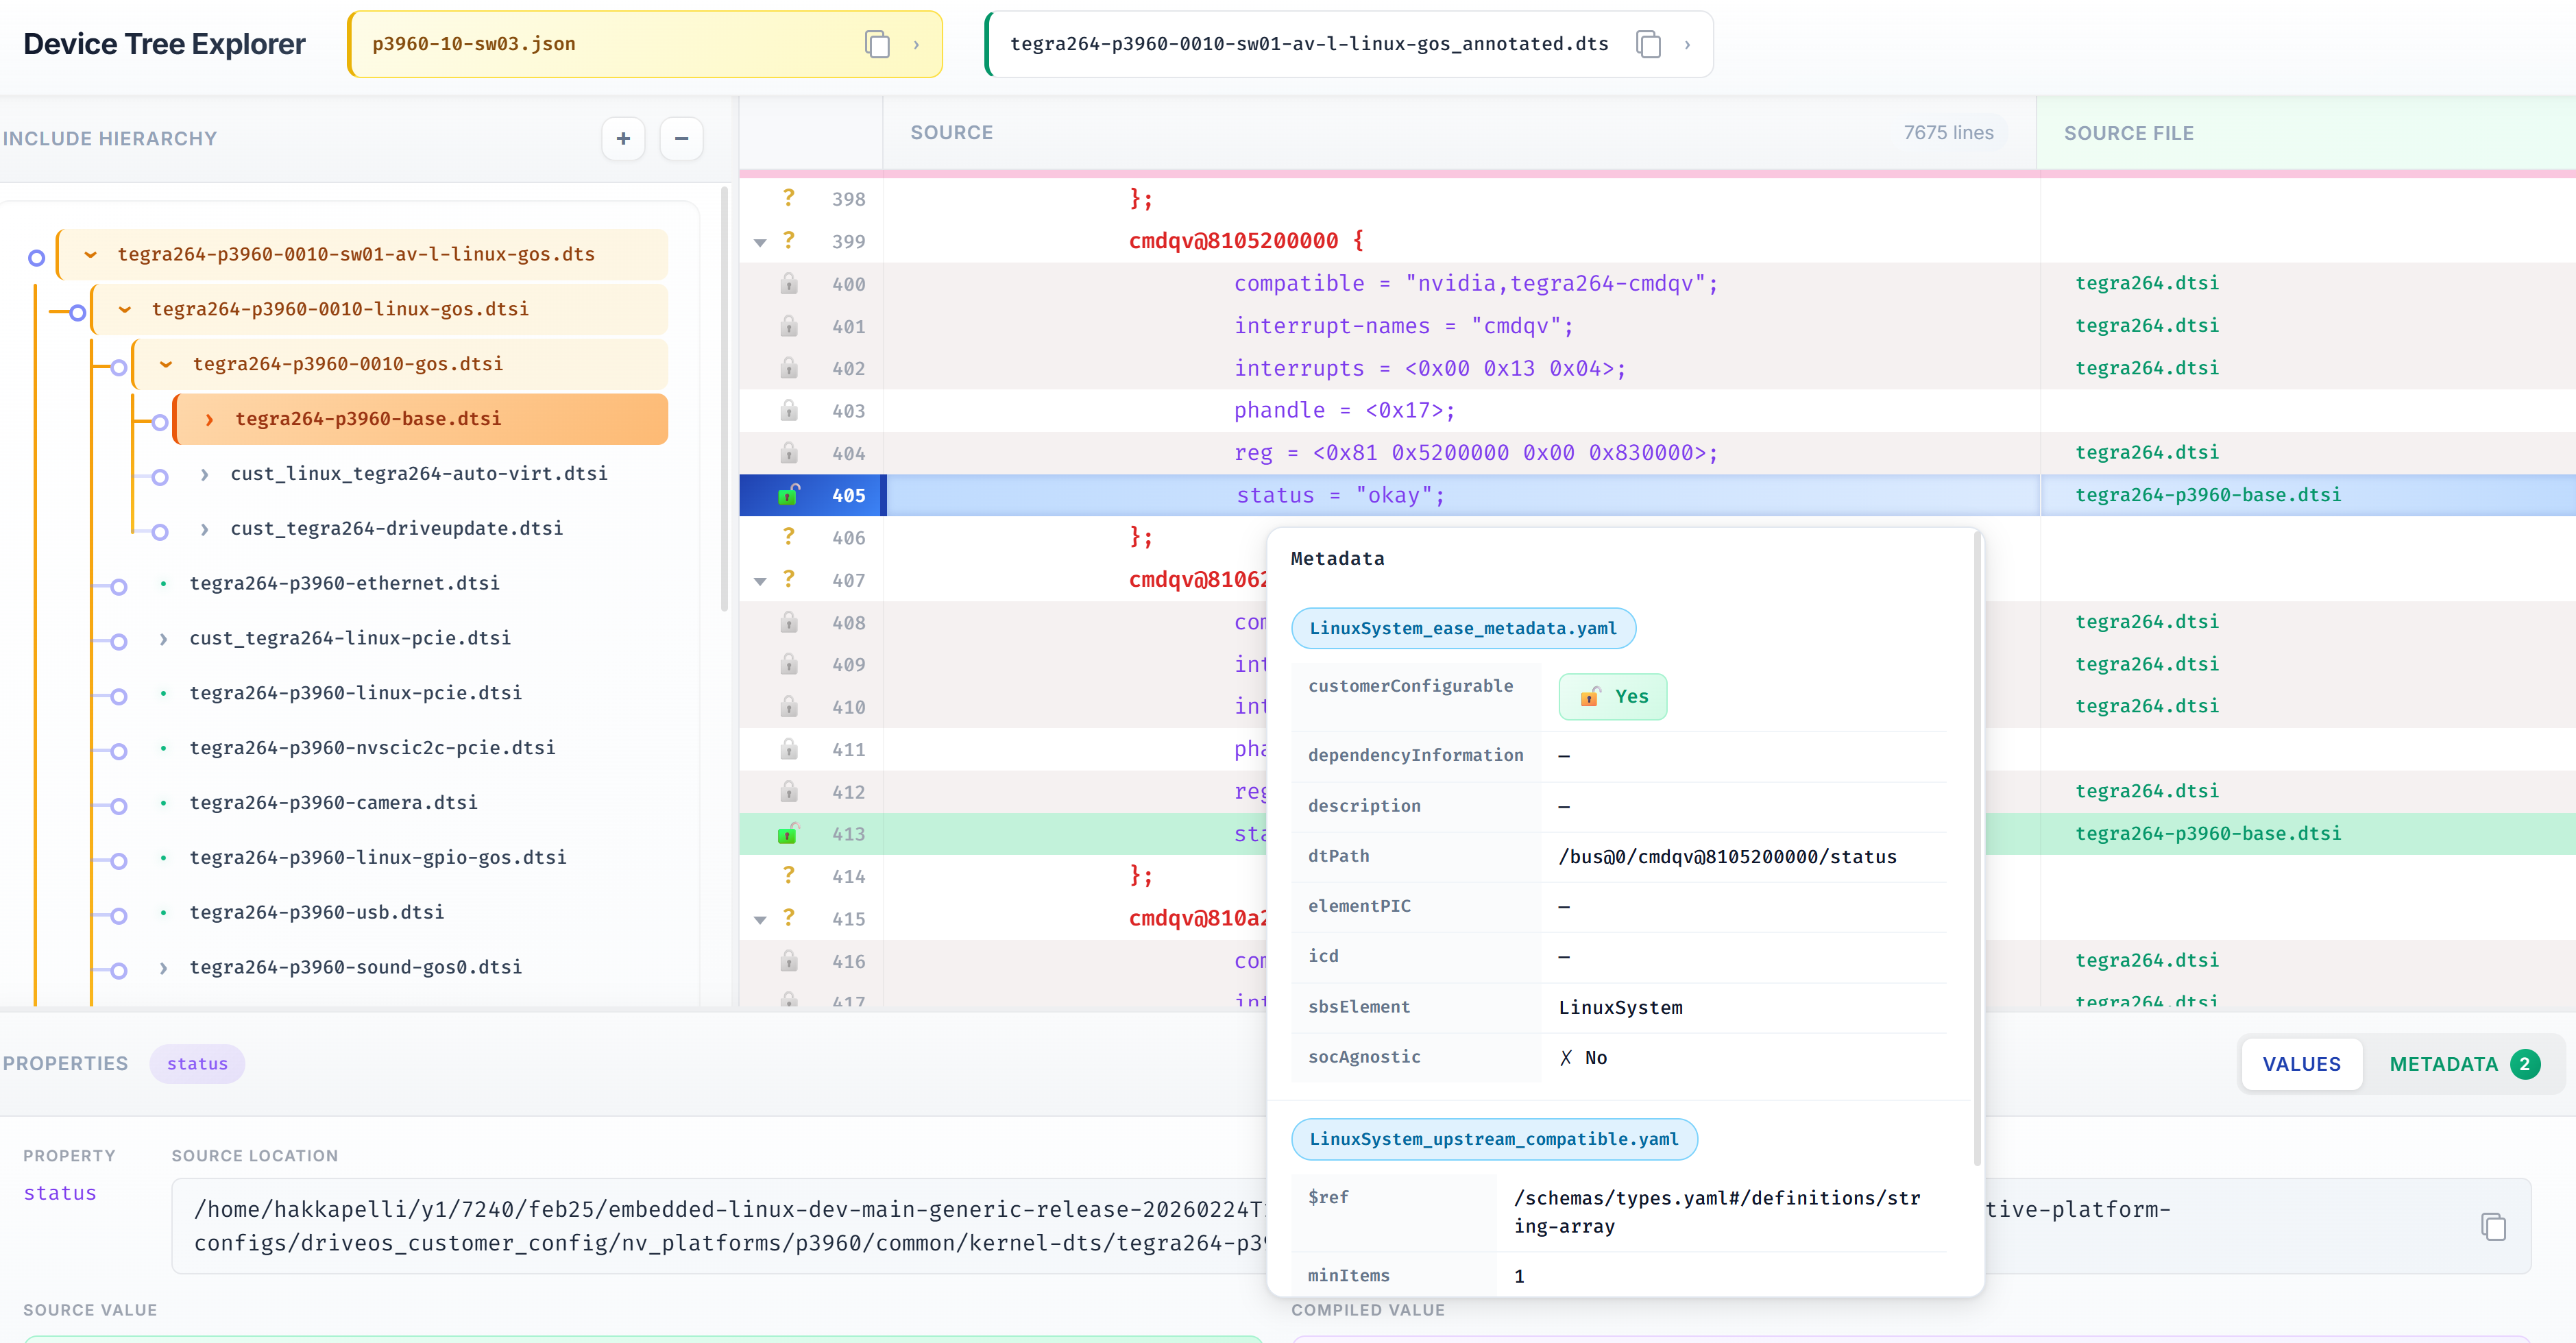
Device Tree Visualizer UI#
Steps to Run the Tool#
1. Generate Device Tree Blobs (DTBs)#
Run bind_partitions for your platform. Annotations are enabled by default:
bind_partitions -b p3960-10-sw03 linux
Refer to the Bind Partitions section
for more information on the bind_partitions command.
2. Launch the Device Tree Visualizer Tool#
Go to the libdt directory in the build output and run the launch script:
cd $OUT/libdt
bash run_app.sh --port <PORT>
For example:
cd $SDK_TOP/drive-foundation/virtualization/hypervisor/t26x/configs/t264ref-release/pct/p3960-10-sw03/libdt
bash run_app.sh --port 8080
Once launched, open http://localhost:<PORT> in a browser to view the
interface.
3. Remote Access (Optional)#
If the Device Tree Visualizer is running on a remote host (VM or Docker) and you want to view the output on your local machine, forward the application port to access the interface locally.
- Using VS Code:
Open the Terminal in VS Code.
Go to the Ports tab.
Add the application port (e.g.,
8080).
Using SSH:
ssh -L <PORT>:localhost:<PORT> <user>@<host>
For example:
ssh -L 8080:localhost:8080 user@remote-vm-ip
Using Docker:
docker run -p <PORT>:<PORT> <image_name>
Features#
The Device Tree Visualizer provides the following features:
- Device Tree explorer section
Use the Device Tree explorer dropdowns at the top of the UI to select the required DTS file. Select the board configuration JSON to choose the right platform, then select the DTS file from the cascading category menu (BPMP, GOS, Server).
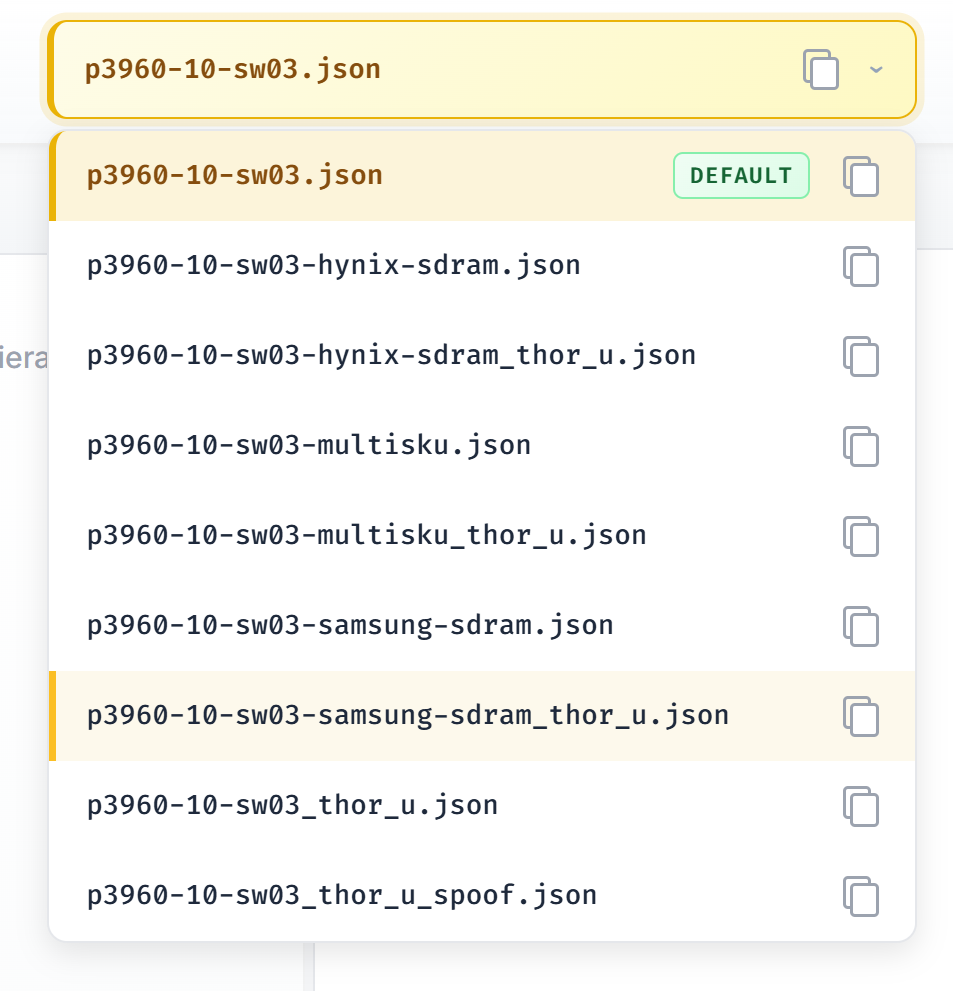
Board configuration selection dropdown#
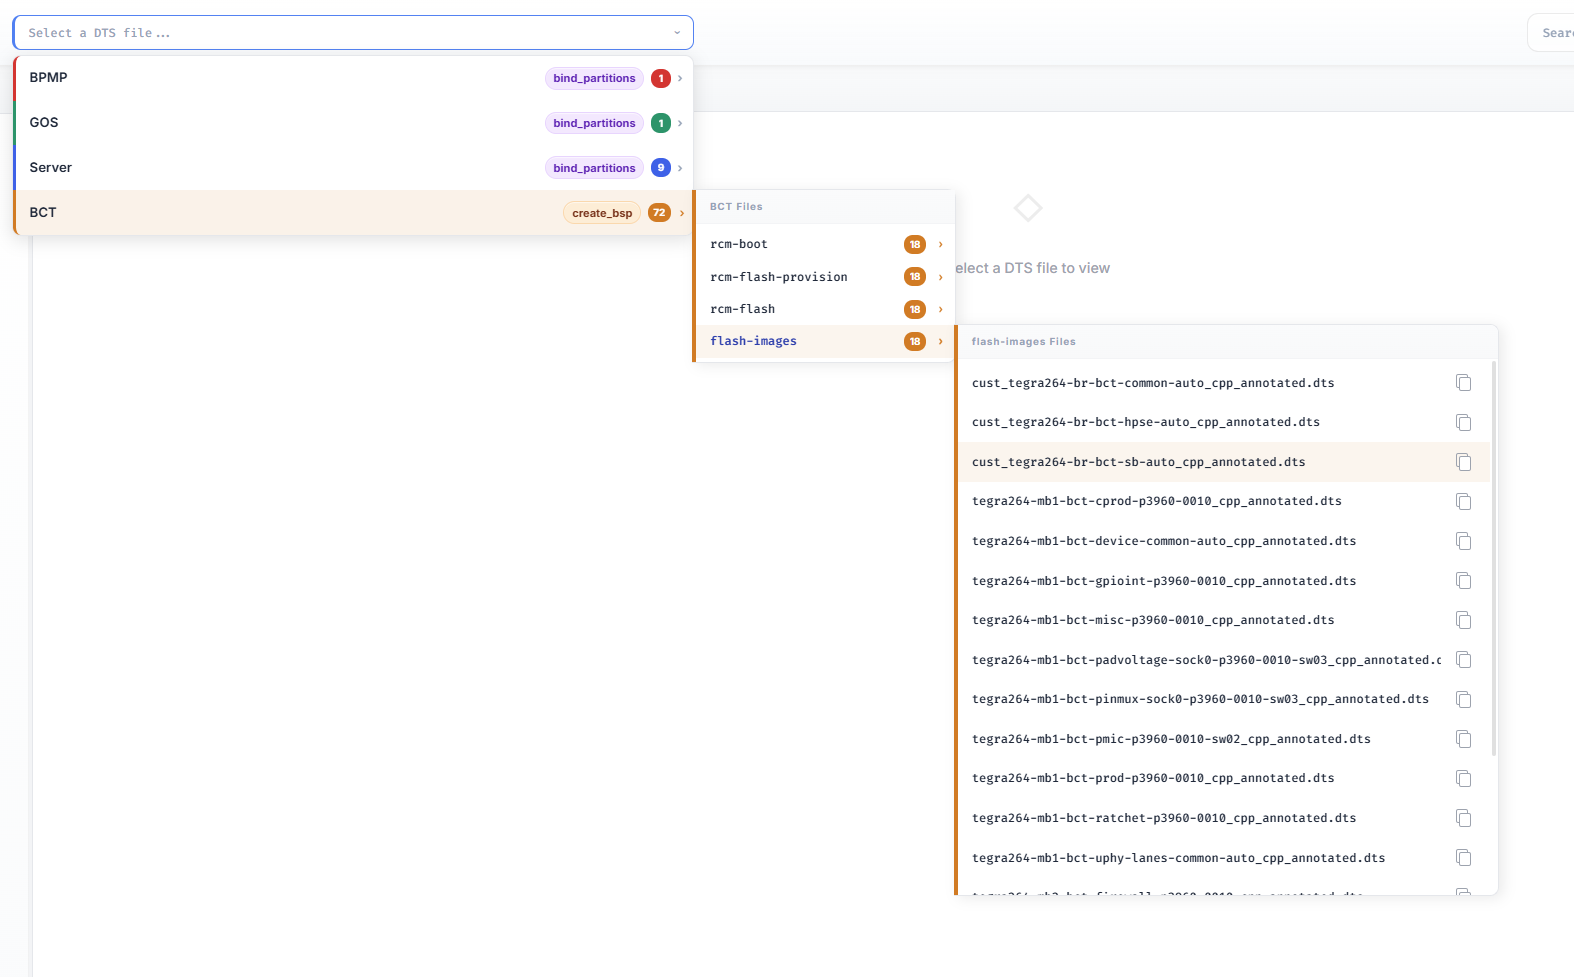
DTS file selection dropdown#
- Include Hierarchy section
A tree view that shows the include relationships between files. Nodes can be expanded or collapsed. Selecting a property in the code display panel highlights its source file in the include hierarchy tree.
- Code Display section
Displays line-numbered DTS content, color-coded by source file. Supports code folding and shows indicators for customer-configurable properties.
- Search
Search across the selected annotated DTS content to find nodes, properties, values, or source-file names. The search controls show the current match number and total matches, and provide next and previous navigation.
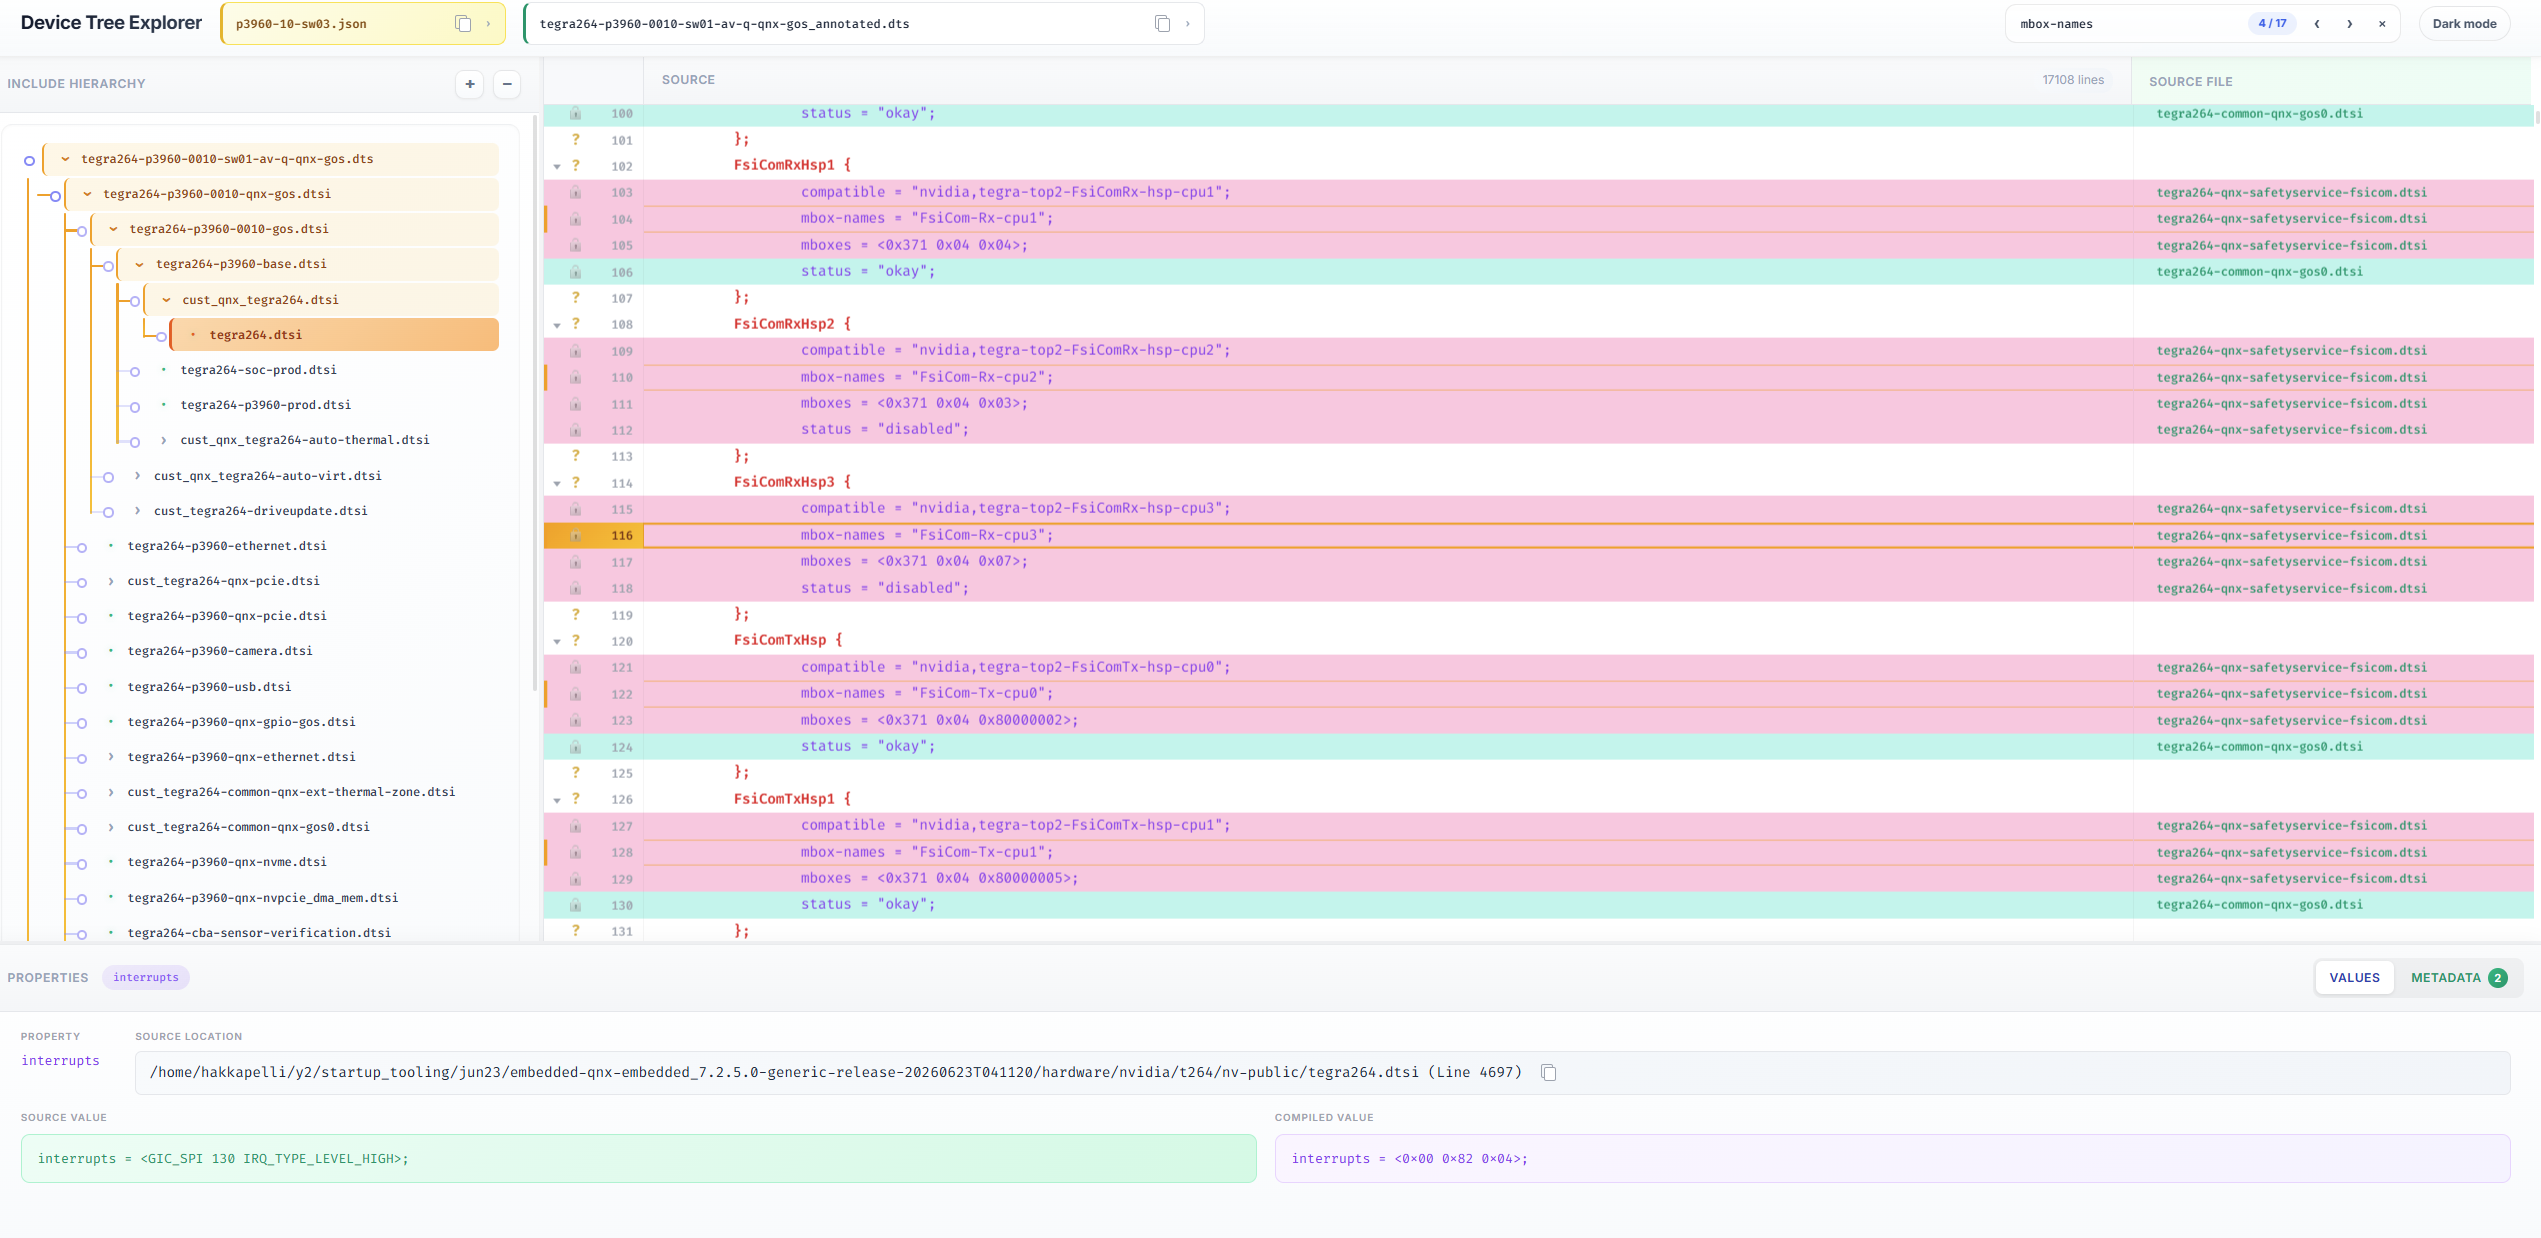
Device Tree Visualizer search#
- Property Details
A panel with two tabs:
Values – Shows source file location, source value, compiled value, and associated SHR IDs.
Metadata – Shows schema and metadata information in separate cards. The fields displayed here correspond to the upstream specification and EASE metadata fields described in Configuration Specification.
- Interactive Navigation
Click on a property in the code display panel to highlight its source in the include hierarchy. Hover over a property to see a tooltip with schema details. Paths can be copied to the clipboard.
- Light and dark mode
Switch between light and dark themes from the UI. Both themes support the same device tree navigation, search, source highlighting, and property details views.
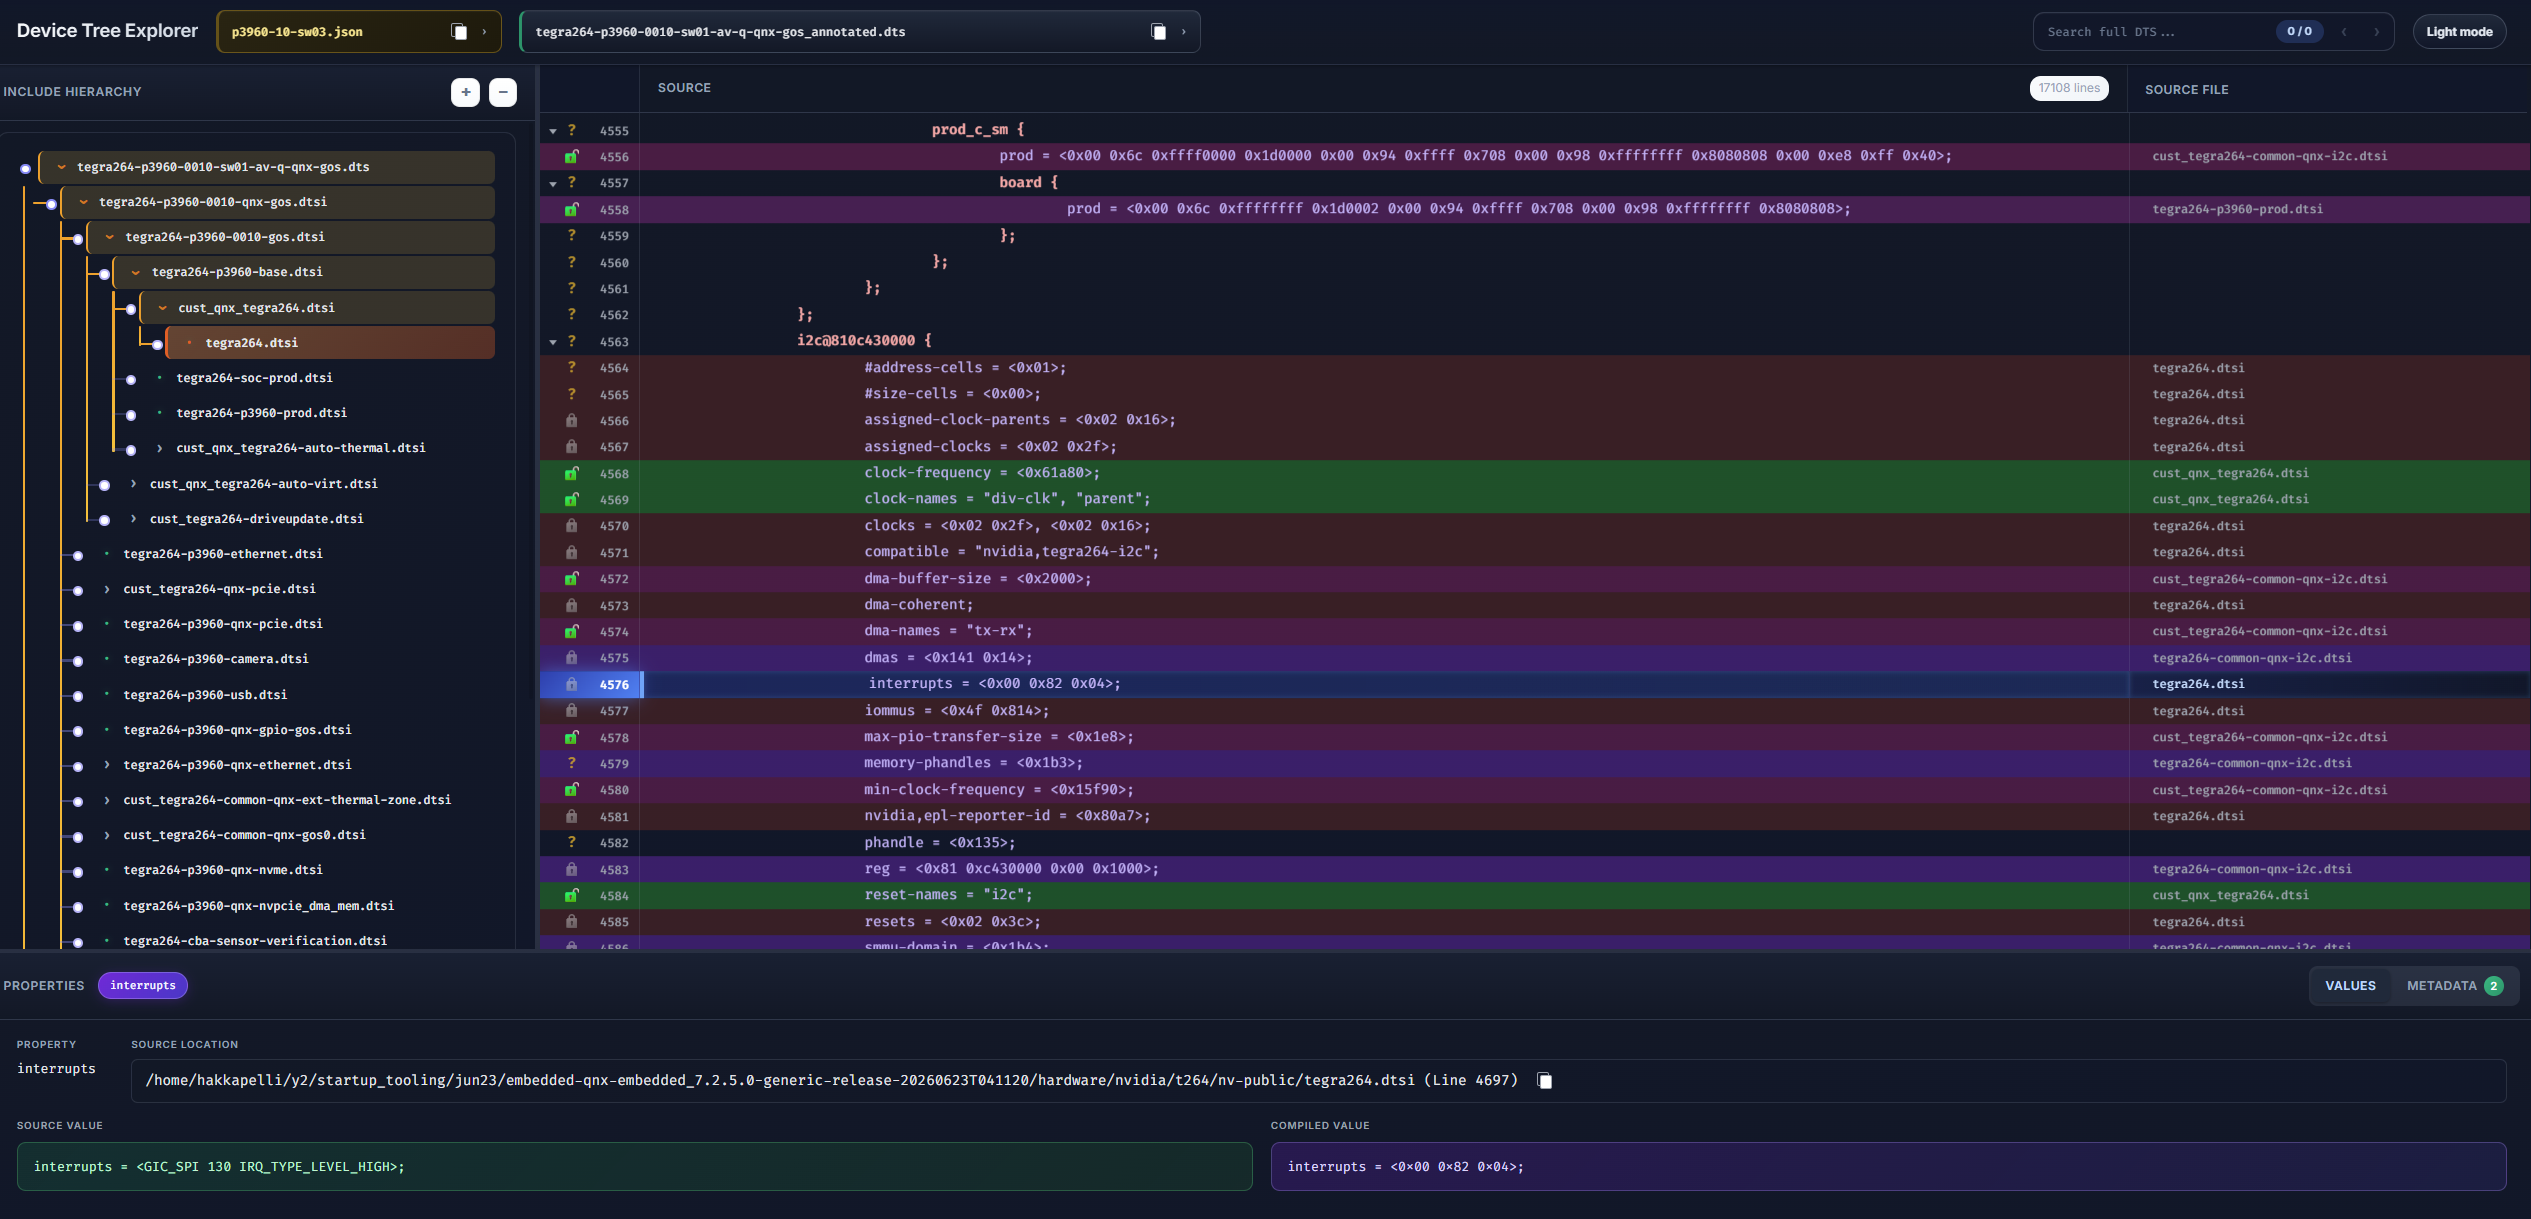
Device Tree Visualizer dark mode#
Annotated DTS Files#
During the bind_partitions step, annotated DTS files are generated alongside
the compiled DTB. These files are the output of the C preprocessor stage, where
all includes are resolved and macros are expanded into a single file. Each line
also contains an inline annotation with the source file and line number it
originated from.
The following is an example of an annotated DTS file:
/ {
    bus@0 { /* tegra234-p3701.dts:5 */
        host1x@13e00000 { /* tegra234-p3701.dts:10 */
            compatible = "nvidia,tegra234-host1x"; /* tegra-host1x.dtsi:42 */
            status = "okay"; /* ../../common/kernel-dts/tegra-host1x.dtsi:55 */
            reg = <0x0 0x13e00000 0x0 0x10000>; /* /drive/drive-foundation/platform/tegra/common/kernel-dts/tegra-host1x.dtsi:60 */
        }; /* tegra234-p3701.dts:12 */
    }; /* tegra234-p3701.dts:6 */
};
Each annotation is an inline C-style comment in the format
/* <source>:<line_number> */. The source can be a direct filename, a
relative path, or an absolute path. When a property is defined across multiple
includes, annotations are comma-separated (e.g.,
/* file1.dtsi:10,file2.dtsi:20 */).
The tool resolves all path formats to absolute paths and uses these annotations to provide traceability from the compiled output back to the original source files.