Using the ftrace Method#
The following procedure summarizes the steps for using the ftrace method to measure CPU utilization:
Reset the
ftracebuffers and set up the debugfs for scheduler tracing.Enable trace collection.
Run the workload.
Note
See the Guidelines section for considerations regarding running the workload.
Stop tracing and save the trace data.
Collect another report for an idle system for the duration of experiment but without workload, for example, sleep 60.
All of the preceding steps are automated in the following ftrace script. Use this entire script for measuring CPU utilization.
#!/bin/bash

INIT_TIME=10
EXIT_TIME=10
TEST_TIME=60
APP_RUN_TIME=$((INIT_TIME + TEST_TIME + EXIT_TIME))

# >>>>>>>>>>>>>>> FIXME <<<<<<<<<<<<<<<<
# SPECIFY THE FILENAME FOR STORING TRACE DATA

IDLE_TRACE_FILE="<MY-IDLE-TRACE>.txt"
WORKLOAD_TRACE_FILE="<MY-WORKLOAD-TRACE>.txt"

# >>>>>>>>>>>>>>> FIXME <<<<<<<<<<<<<<<<
# POPULATE THE FOLLOWING FUNCTION AS PER YOUR WORKLOAD

runWorkload () {
    # Sepcify the command-line to execute the workload.
    # Make sure that the workload executes for at-least
    # ${APP_RUN_TIME} seconds.

    echo "[FG-SHELL] Running workload..."
    ./<MY COMMAND-LINE FOR RUNNING WORKLOAD>

    echo "[FG-SHELL] Workload complete!"
}

#############################################################
#       DO NOT CHANGE ANYTHING IN THE SCRIPT BELOW          #
#############################################################
shopt -s expand_aliases

tracefs="/sys/kernel/tracing"
schedTraceEvents="${tracefs}/events/sched"

alias displayTraceBuffer='cat ${tracefs}/trace'
alias flushTraceBuffer='echo > ${tracefs}/trace'
alias turnTracingOn='echo 1 > ${tracefs}/tracing_on'
alias turnTracingOff='echo 0 > ${tracefs}/tracing_on'
alias ownTracefsDir='sudo chown -R nvidia:nvidia ${tracefs}'
alias makeTraceClockMonotonic='echo mono > ${tracefs}/trace_clock'
alias increasePerCoreTraceBufferSize='echo 10000 > ${tracefs}/buffer_size_kb'
alias enableSchedTraceEvents='echo 1 > ${schedTraceEvents}/sched_switch/enable;
                              echo 1 > ${schedTraceEvents}/sched_wakeup/enable;
                              echo 1 > ${schedTraceEvents}/sched_wakeup_new/enable'

configureFtrace () {
    echo "[FG-SHELL] Configuring ftrace..."

    ownTracefsDir
    turnTracingOff
    makeTraceClockMonotonic
    increasePerCoreTraceBufferSize
    enableSchedTraceEvents
}

collectIdleSystemTrace () {
    echo "[FG-SHELL] Collecting idle system trace for ${TEST_TIME} sec..."
    flushTraceBuffer
    turnTracingOn

    sleep ${TEST_TIME}
    turnTracingOff

    echo "[FG-SHELL] Saving idle system trace..."
    displayTraceBuffer &> ${IDLE_TRACE_FILE}
    flushTraceBuffer

    echo "[FG-SHELL] Idle system trace can be seen here: ${IDLE_TRACE_FILE}"
}

configureFtrace
collectIdleSystemTrace

# Invoke background sub-shell to collect trace with workload
(
    echo "[BG-SHELL] Sleeping for init time: ${INIT_TIME} sec..."
    sleep ${INIT_TIME}

    echo "[BG-SHELL] Starting trace-collection..."
    turnTracingOn

    sleep ${TEST_TIME}
    turnTracingOff

    echo "[BG-SHELL] Tracing complete. Recording data..."
    displayTraceBuffer &> ${WORKLOAD_TRACE_FILE}

    echo "[BG-SHELL] Workload trace data can be seen here: ${WORKLOAD_TRACE_FILE}"
) &

# Execute workload in the foreground shell
runWorkload
Running the above script generates the following output on console:
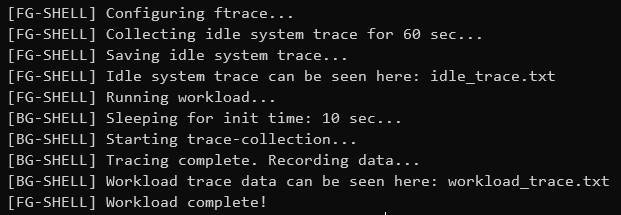
Note
The steps shown in the output appear in the exact same order as the script.
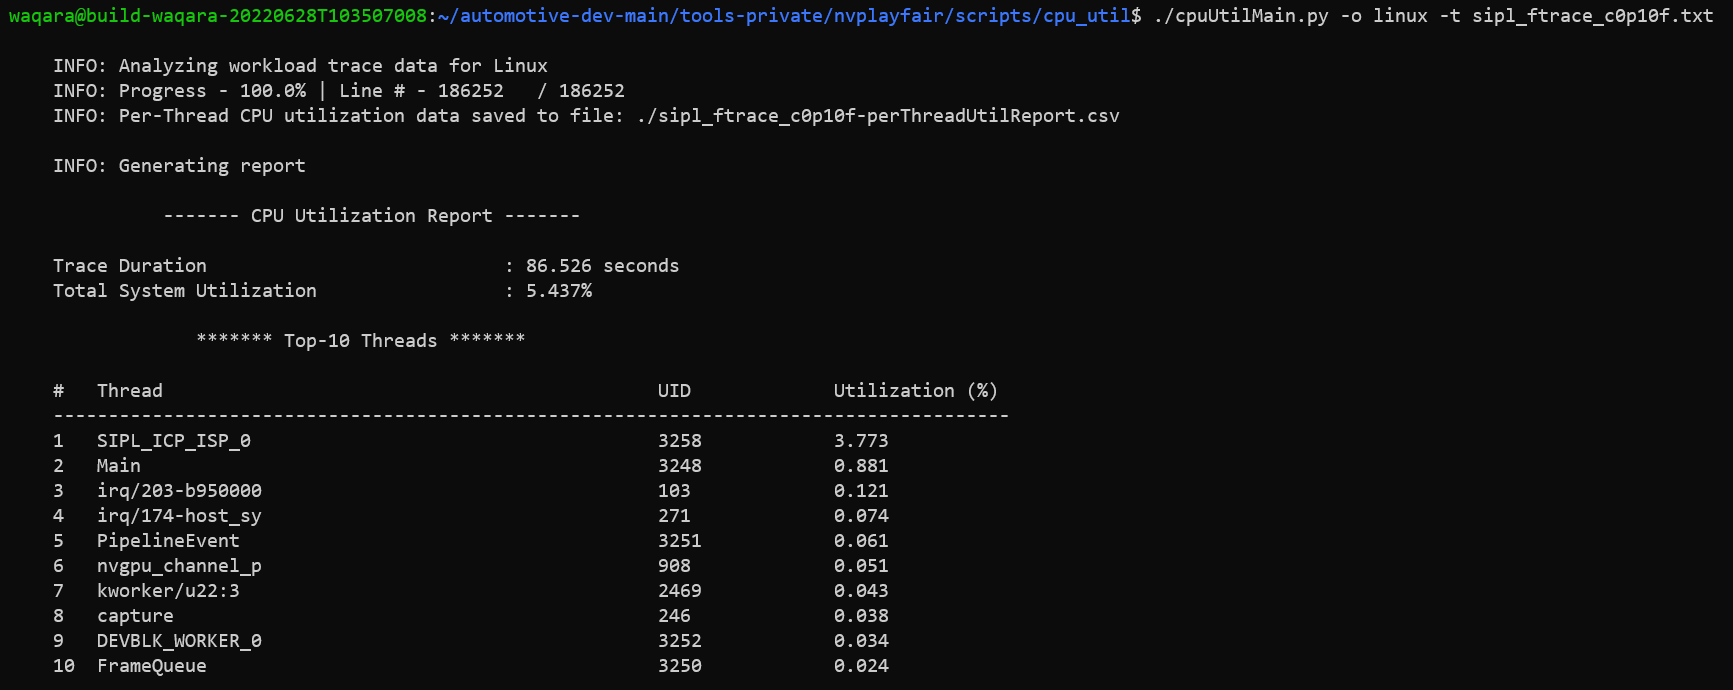
Analyze generated traces (idle system with workload) to create precise utilization reports by using the following command:
./cpuUtilMain.py -o linux -t <file-containing-workload-ftrace-data> [-i <file-containing-idle-system-ftrace-data>]
Note
You can find cpuUtilMain.py in DRIVE Linux SDK in the <sdk-install-dir>/drive-linux/tools/nvplayfair/cpu_util/ directory.
The post-processing script will generate CPU utilization summary on console and save the detailed per-thread utilization report to a file.